Hppy
Overview
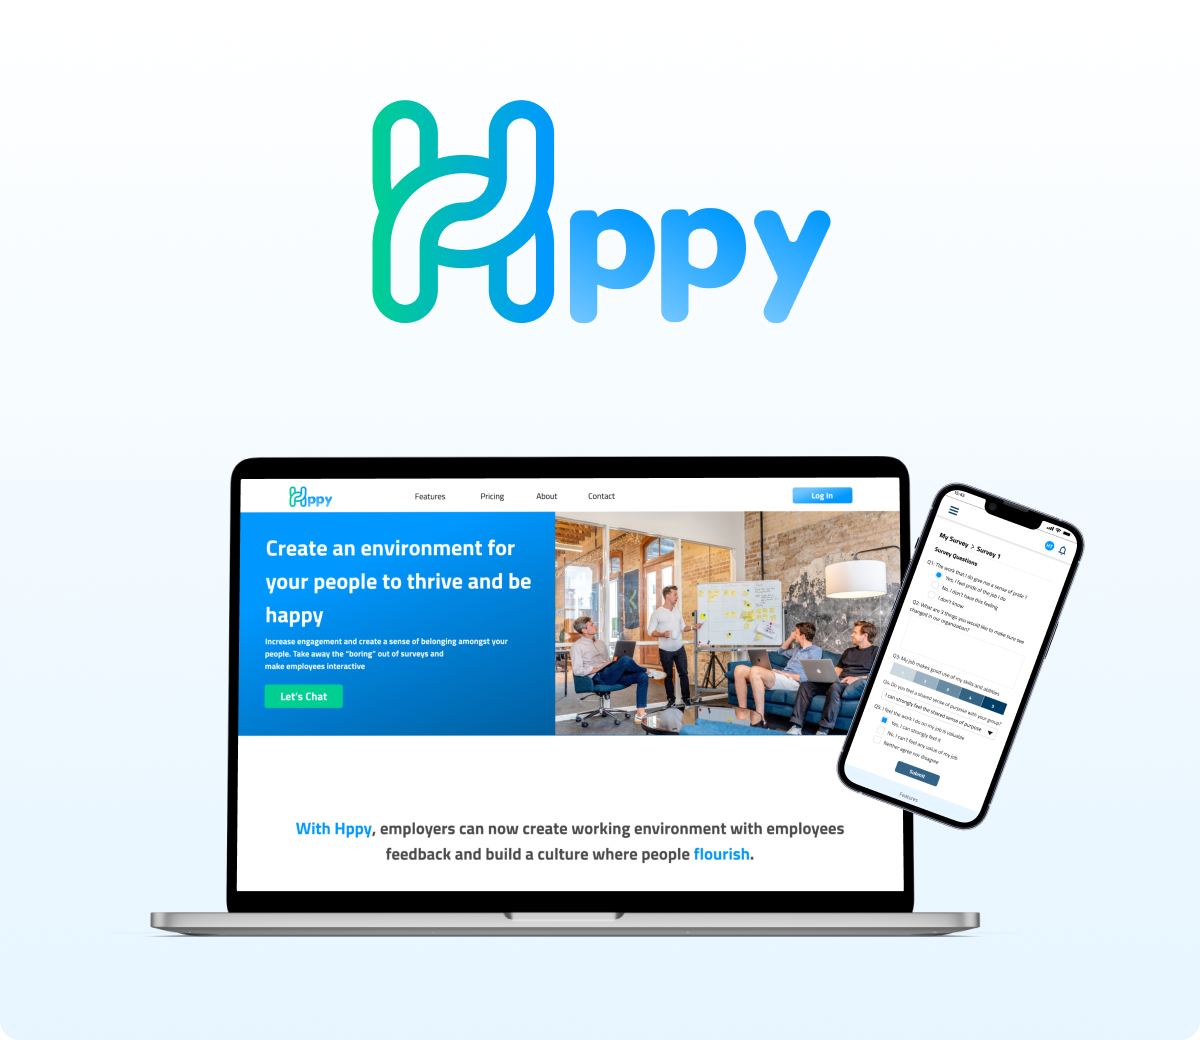
Hppy is a responsive B2B web application that is used by employers to gain insight from their employees through surveys on the platform. The Hppy team consisted of 3 designers and 4 developers, a total of 7 members.
Role
UI/UX Designer
Tools
Figma, Adobe Illustrator, Miro, Trello, Slack
My Contribution
For this project, I was responsible for the userflow, wireframe, proposal and mockup.
Project Background
In medium to large companies, there is usually a disconnect between the managers and employees. In this type of environment, employees are not able to report an issue without feeling like they are jeopardizing their employment key performance indicator.
According to the experiences of the interviewees, we have discovered a widening divide between employers and employees, where the latter saw themselves as nothing more than cogs in a much larger machine. Employee satisfaction has become the key to retaining talented employees.
We believe it is the right time to take away the “boring” out of surveys and make them interactive.
Solution
Hppy is a responsive web app that is data driven. We provide a platform where managers and department heads can gain insight on how their employees feel about their work environment, as well as employees are able to anonymously express themselves regarding their work. Our platform collects the data from employees through surveys and creates reports through sentimental analysis. This allows the managers and department heads to make informed decisions for their employees’ satisfaction.
Main Features
Get Insights From Employees
Collect feedback from employees in the organization, find insights with connected analytics, and plan for effective action to build a people-first culture and happy working environment.
Generate Reports
An application integrates employee performance metrics with employee engagement data. By contextualizing performance with engagement results, feedback, and driver analysis, Hppy is the human central platform that helps organizations understand how to optimize employee experiences for peak performance and engagement.
Anonymous survey responses
Companies can receive honest responses and feedback. Employees are more comfortable telling the truth without any social desirability bias.
AI analysis for text sentiment
Access massive language models that can understand text/feedback from surveys and take appropriate action. Growth accrual data in dashboards that provide an understanding of your employee and culture. Improve the employee relationship and decrease the turnover rate.
User Flow
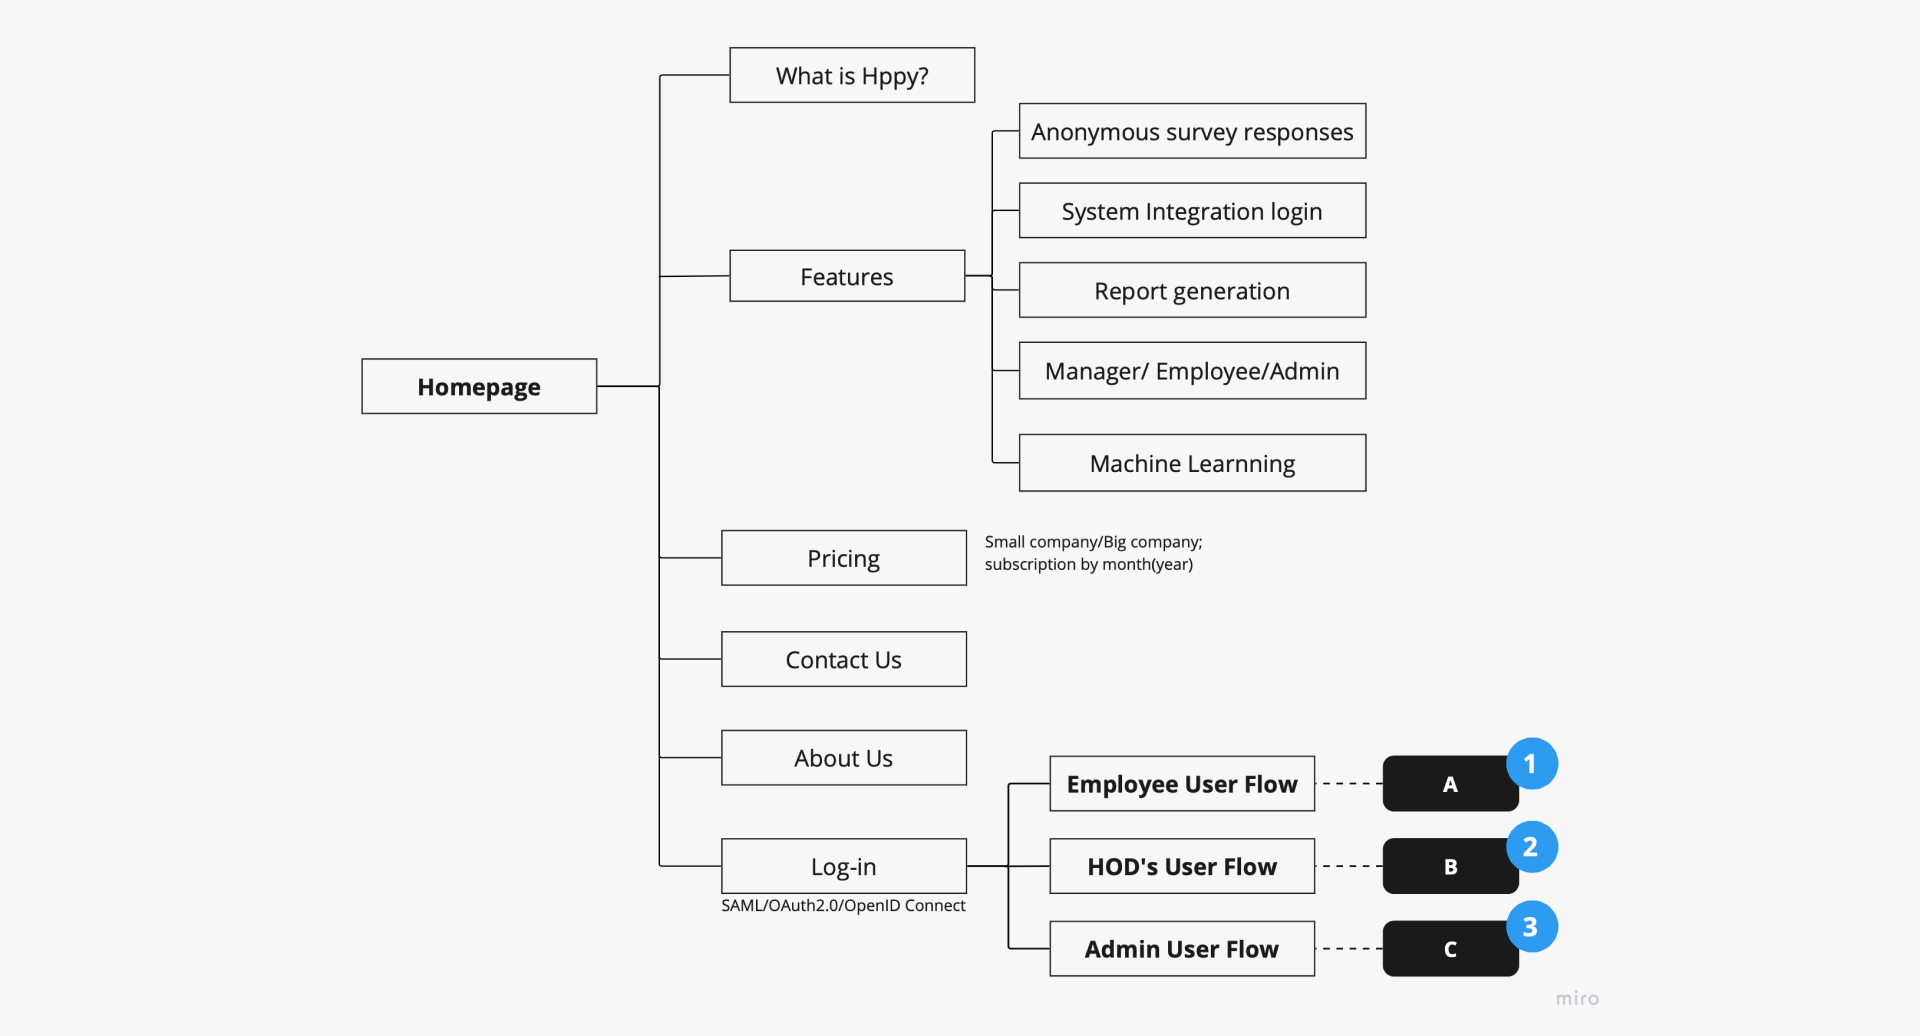
UserFlow Homepage
1, 2, 3: The 3 different users of the system
- Employee of the company
- Head of department
- Admin user
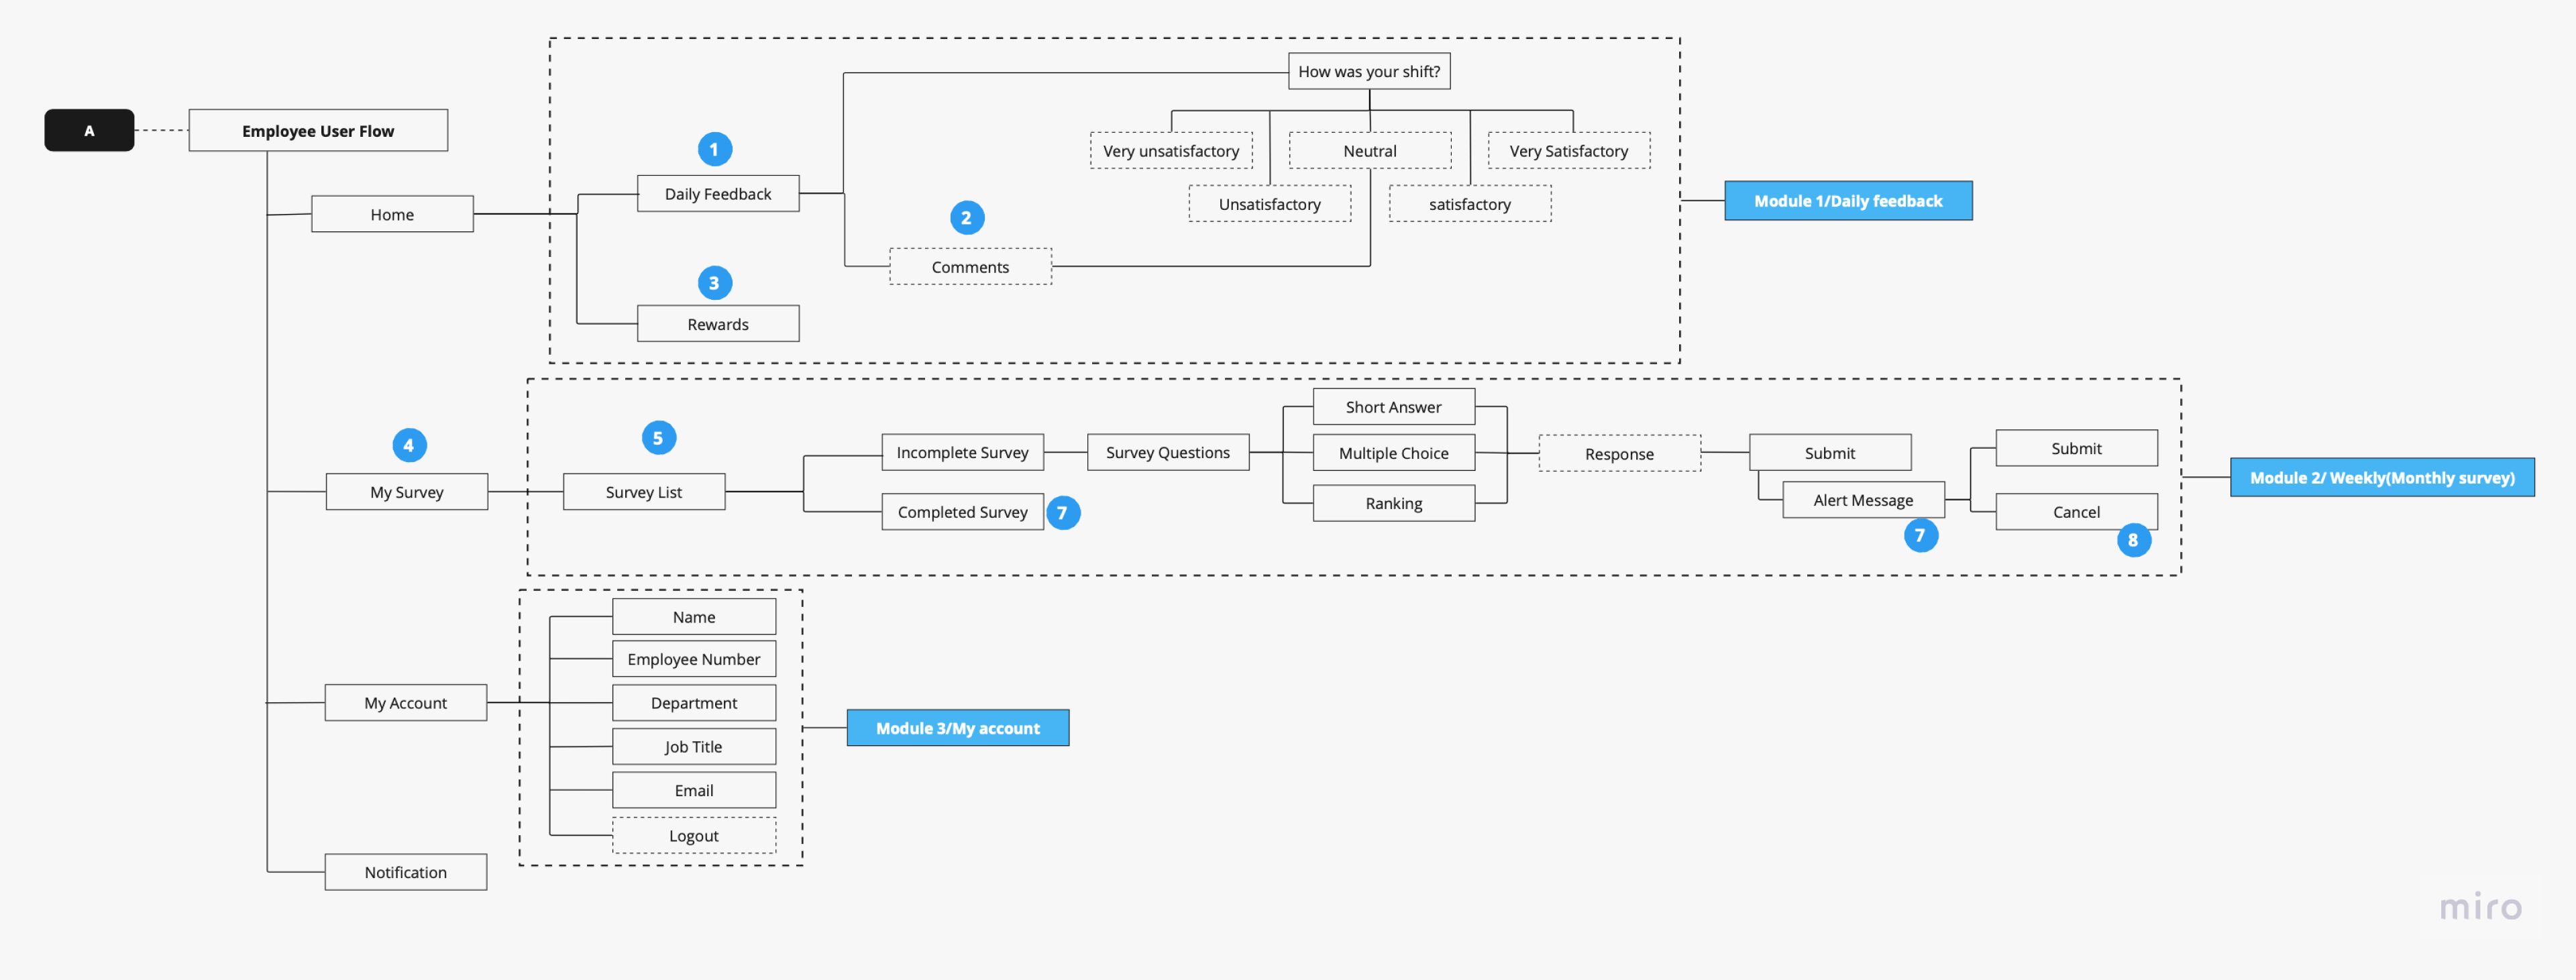
User Flow – Employee
- Employees are required to fill out a daily survey after their shhift
- Comments about their shift
- Rewards is a gamification of the survey in order to encourage users to participate in surveys
- Section for the monthly and weekly surveys
- List of surveys
- Survey that has been completed
- Alert to confirm submission
- Cancel survey submission
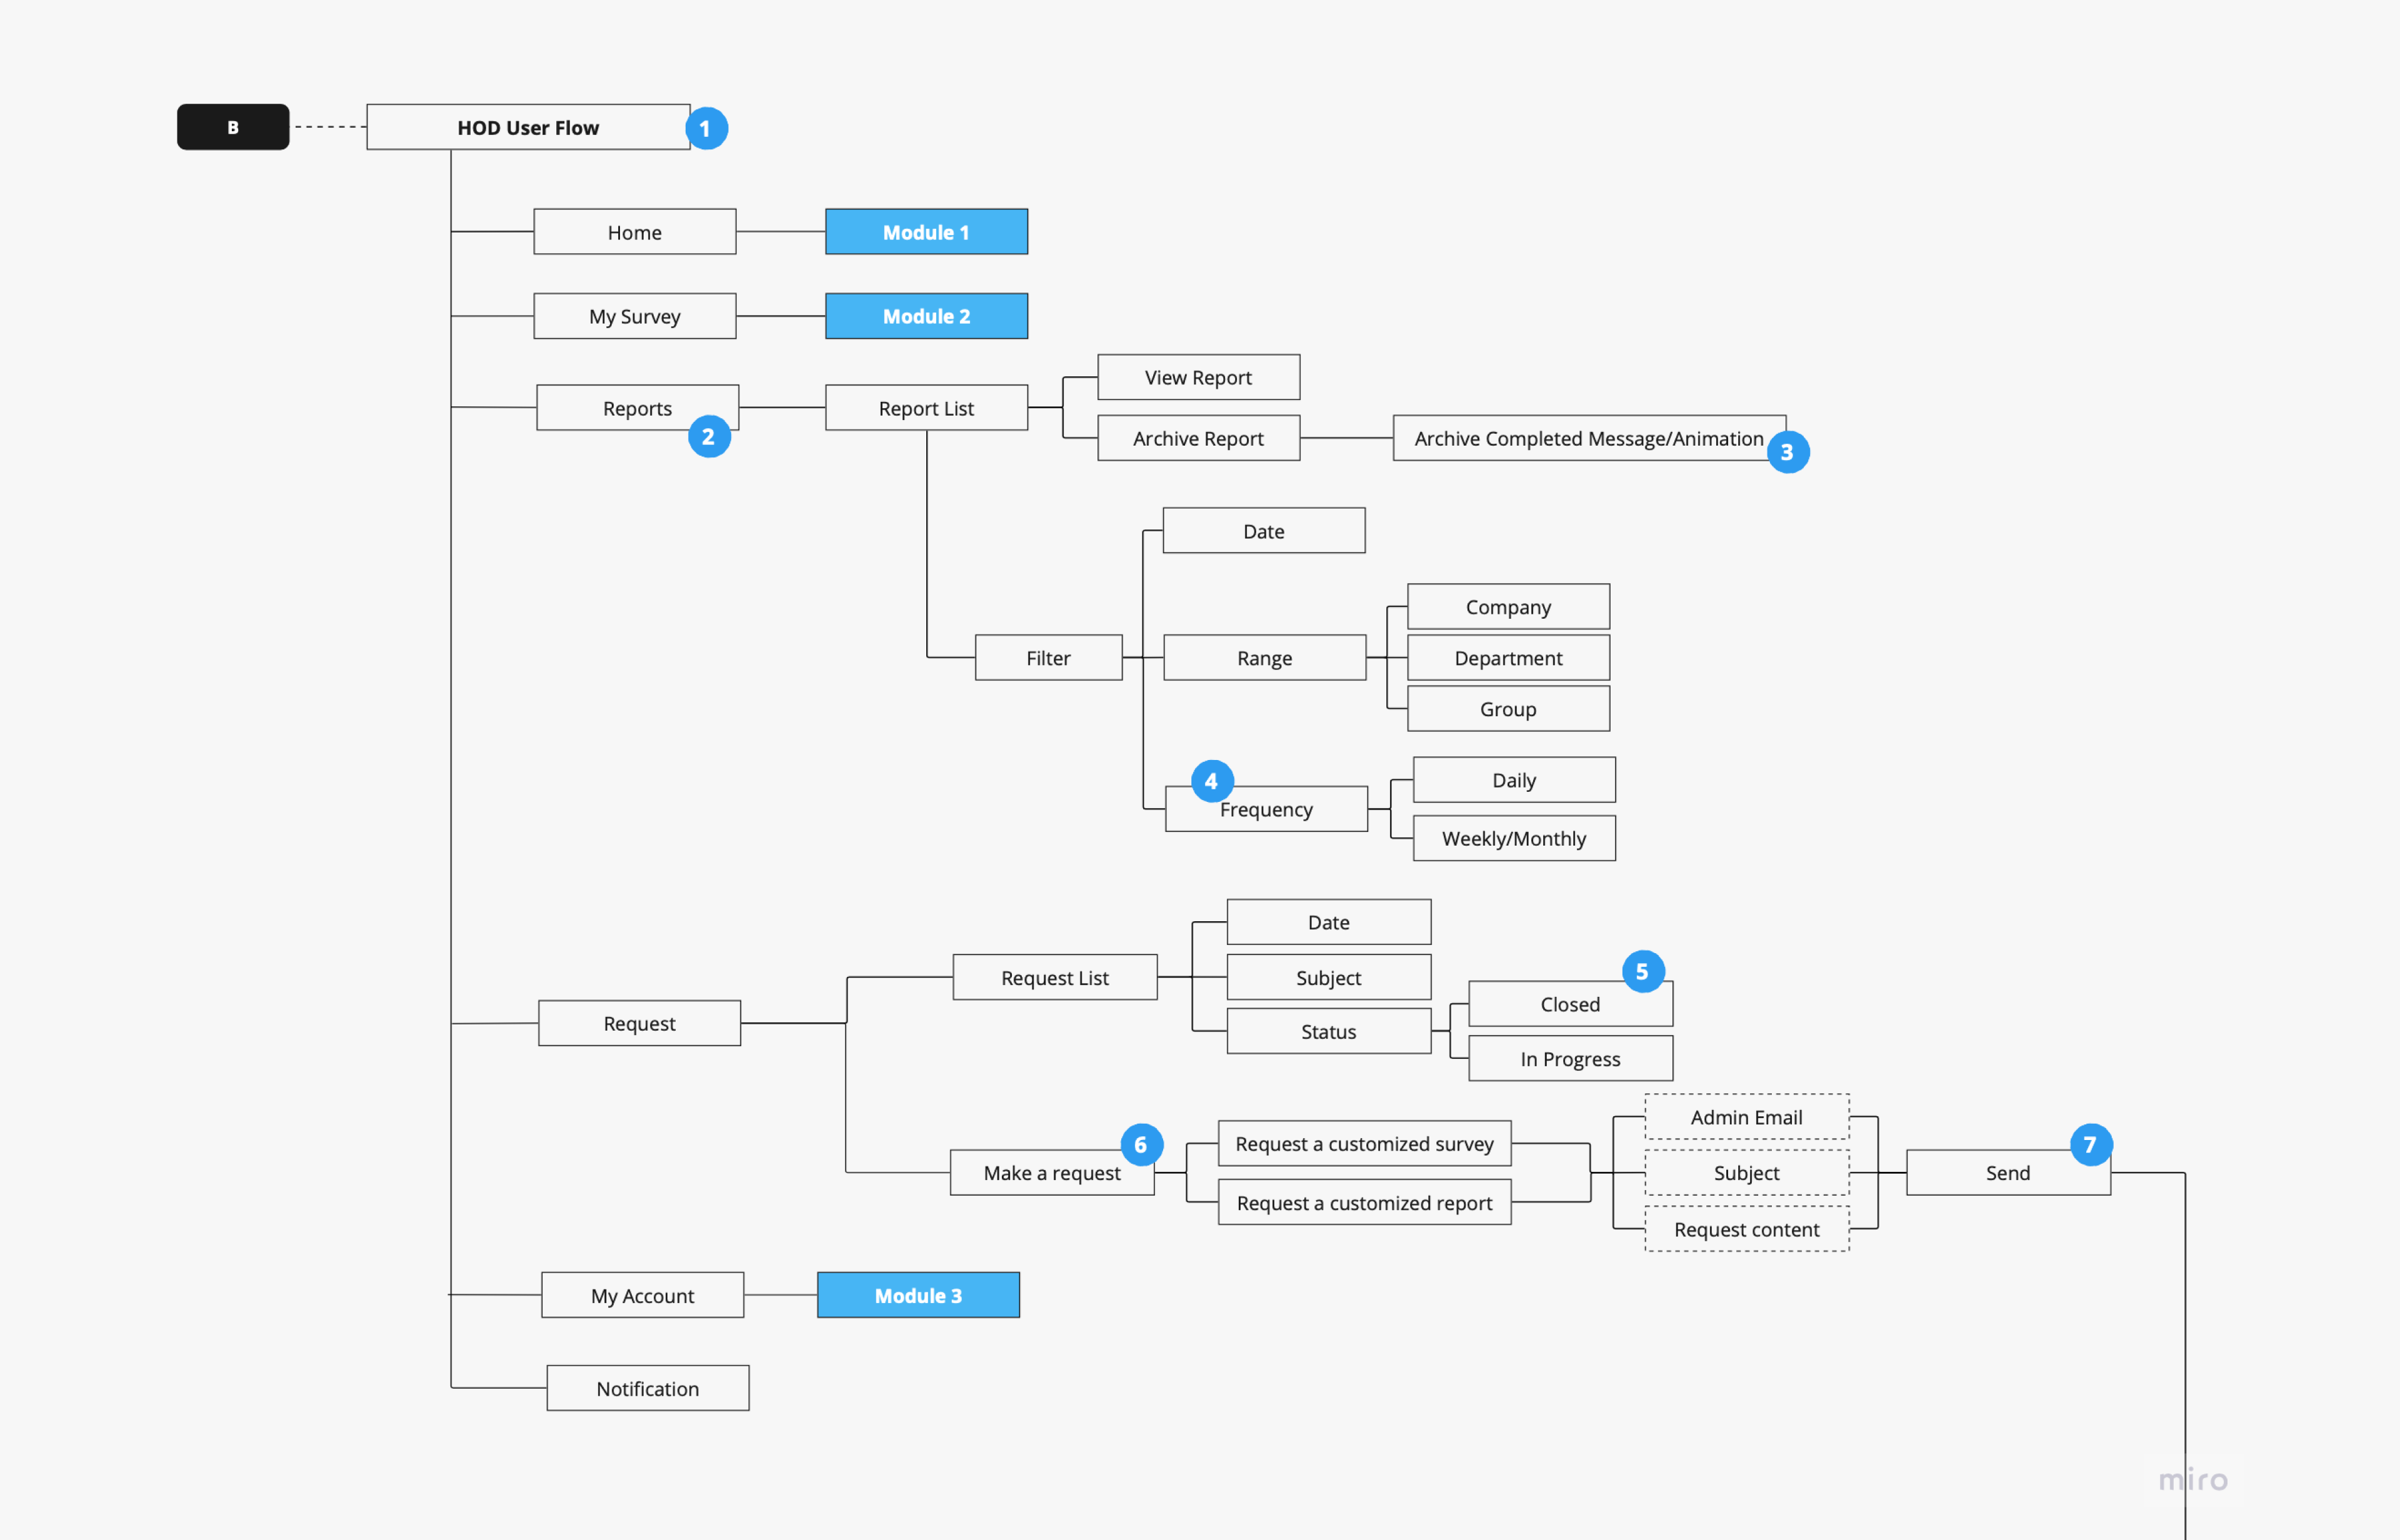
User Flow – HOD
- Head of Department. – They have the same features as users, in addition to see reports and make requests to admin
- Reports based on surveys
- Confirmation that a report was archived
- How often the survey is being issued
- The request is completed
- Create new request
- Send new request to Admin
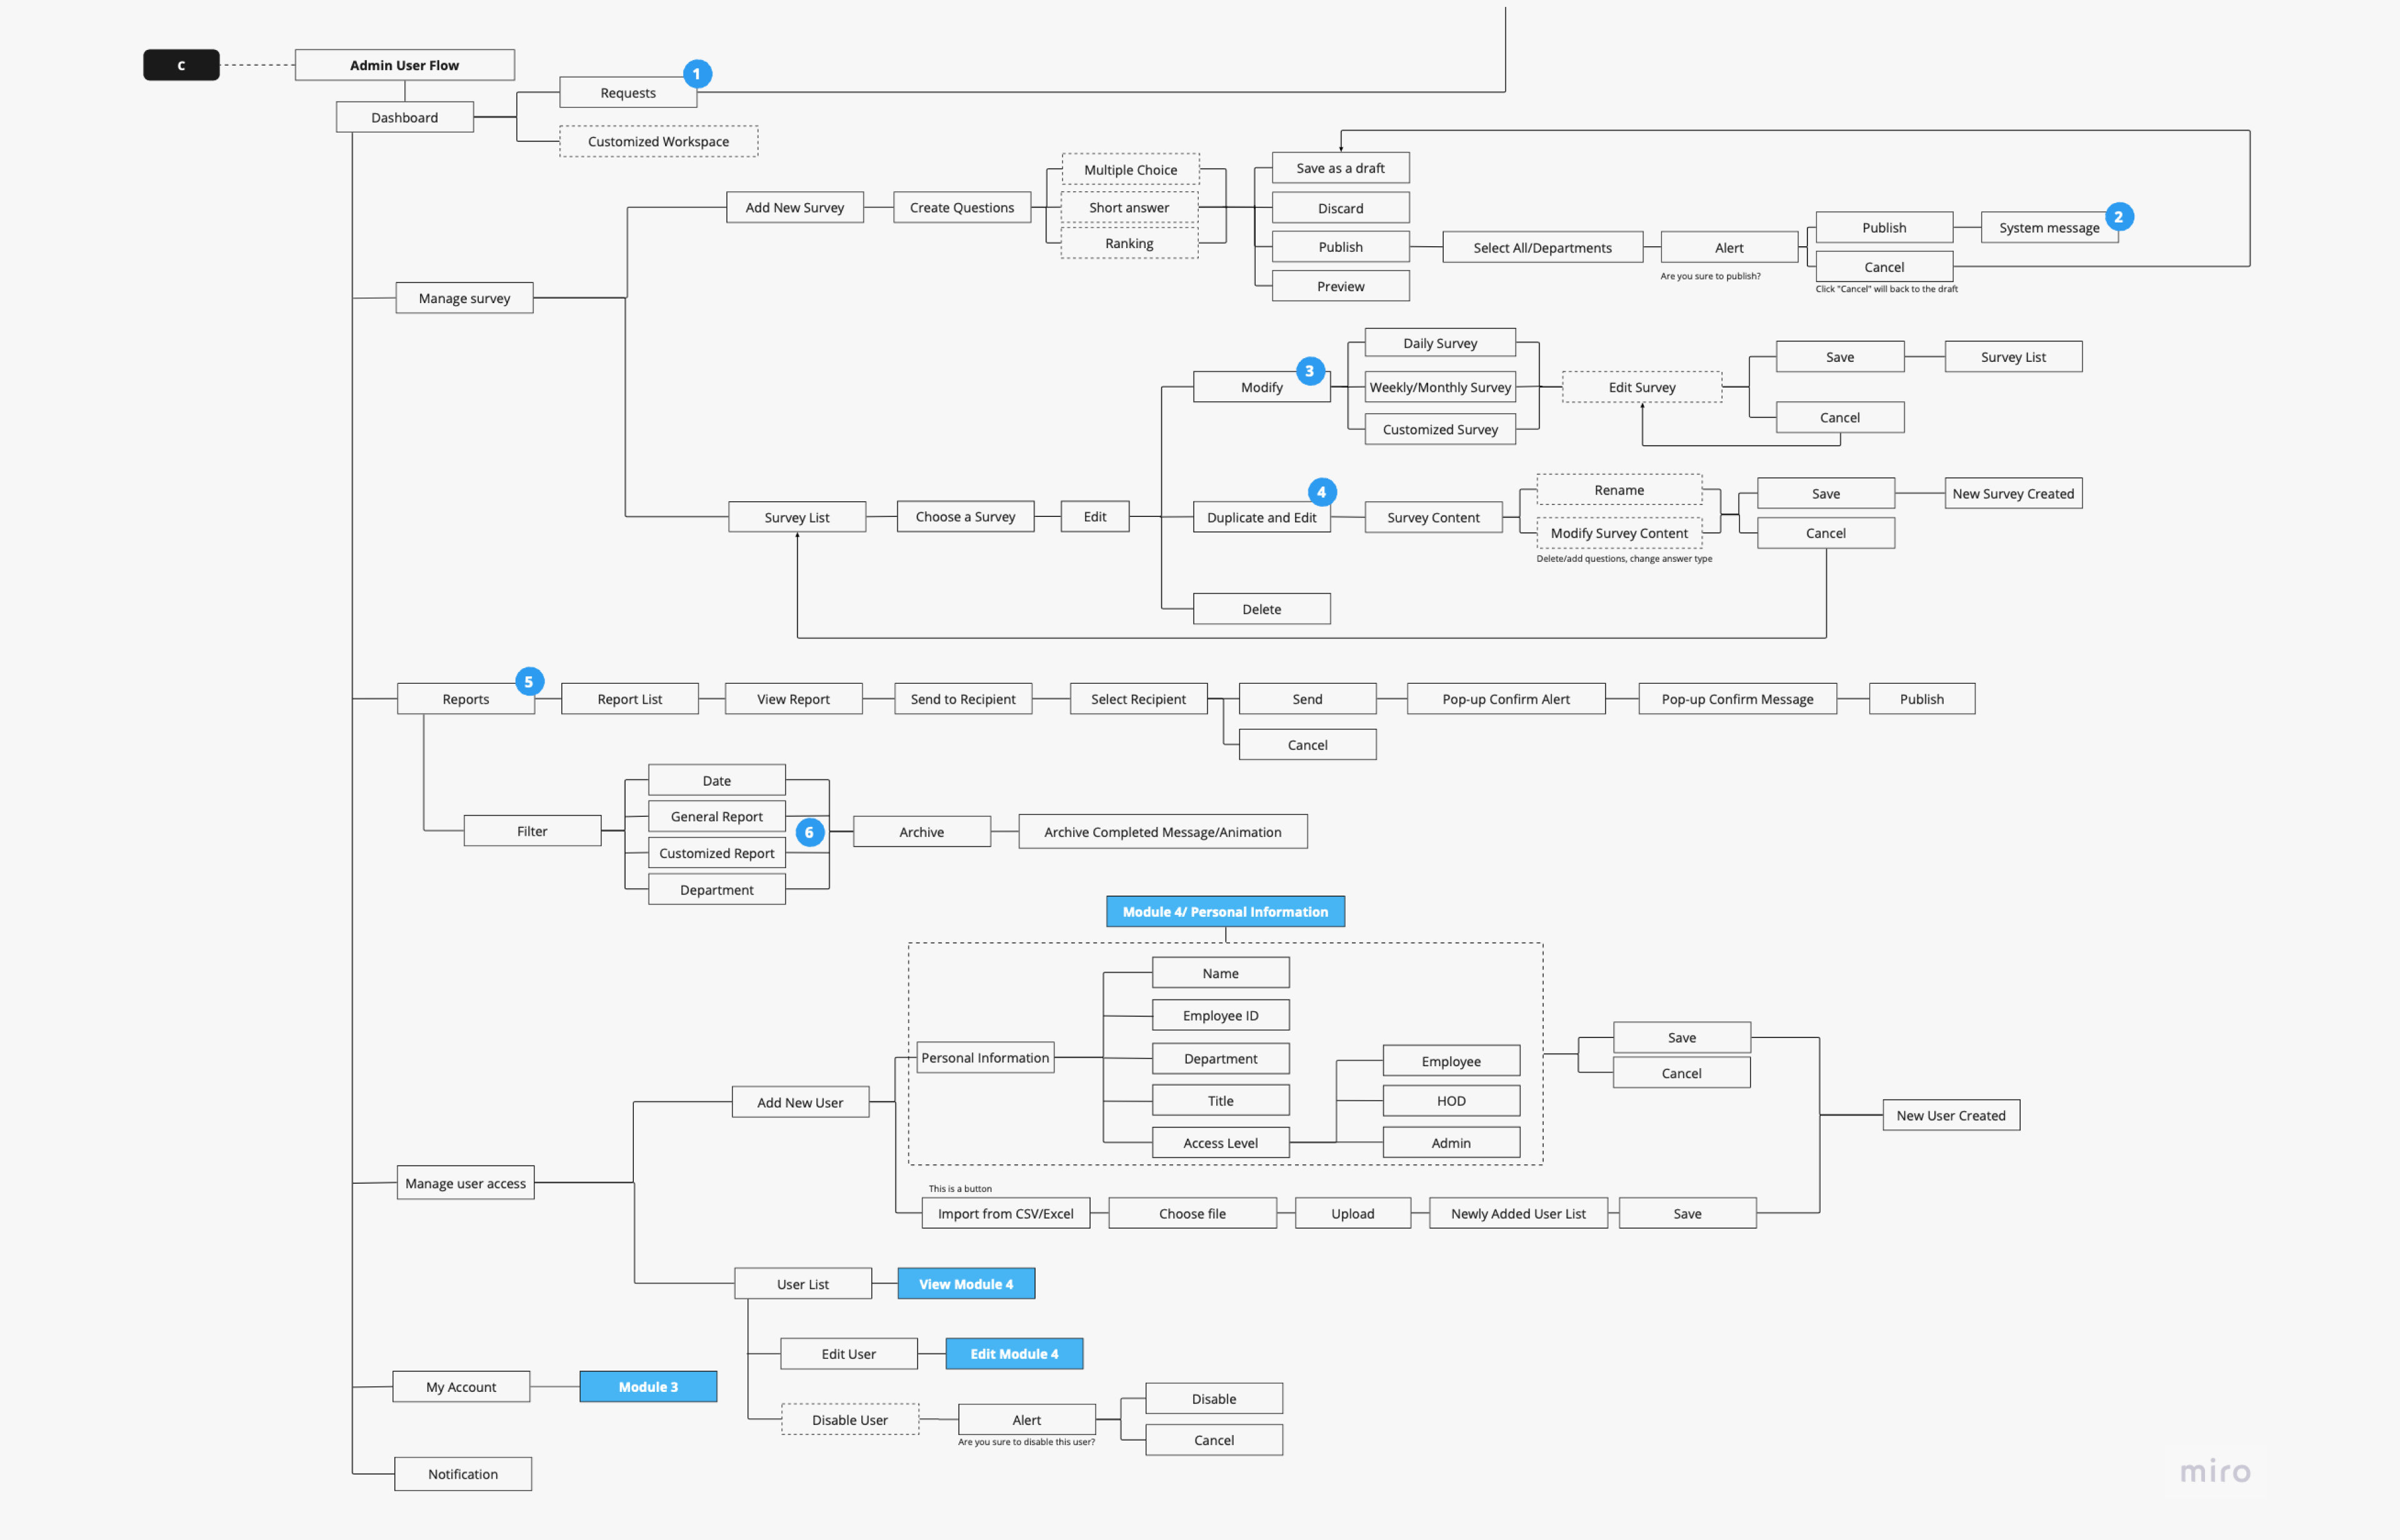
User Flow – Admin
- Requests from HOD
- Confirmation that the survey is published
- Edit survey
- Duplicate survey
- These are the reports generated from the surveys that the admin has issued
- General report are for daily, weekly and monnthly surveys. Customised report are for customised surveys.
Wireframe

Mockup
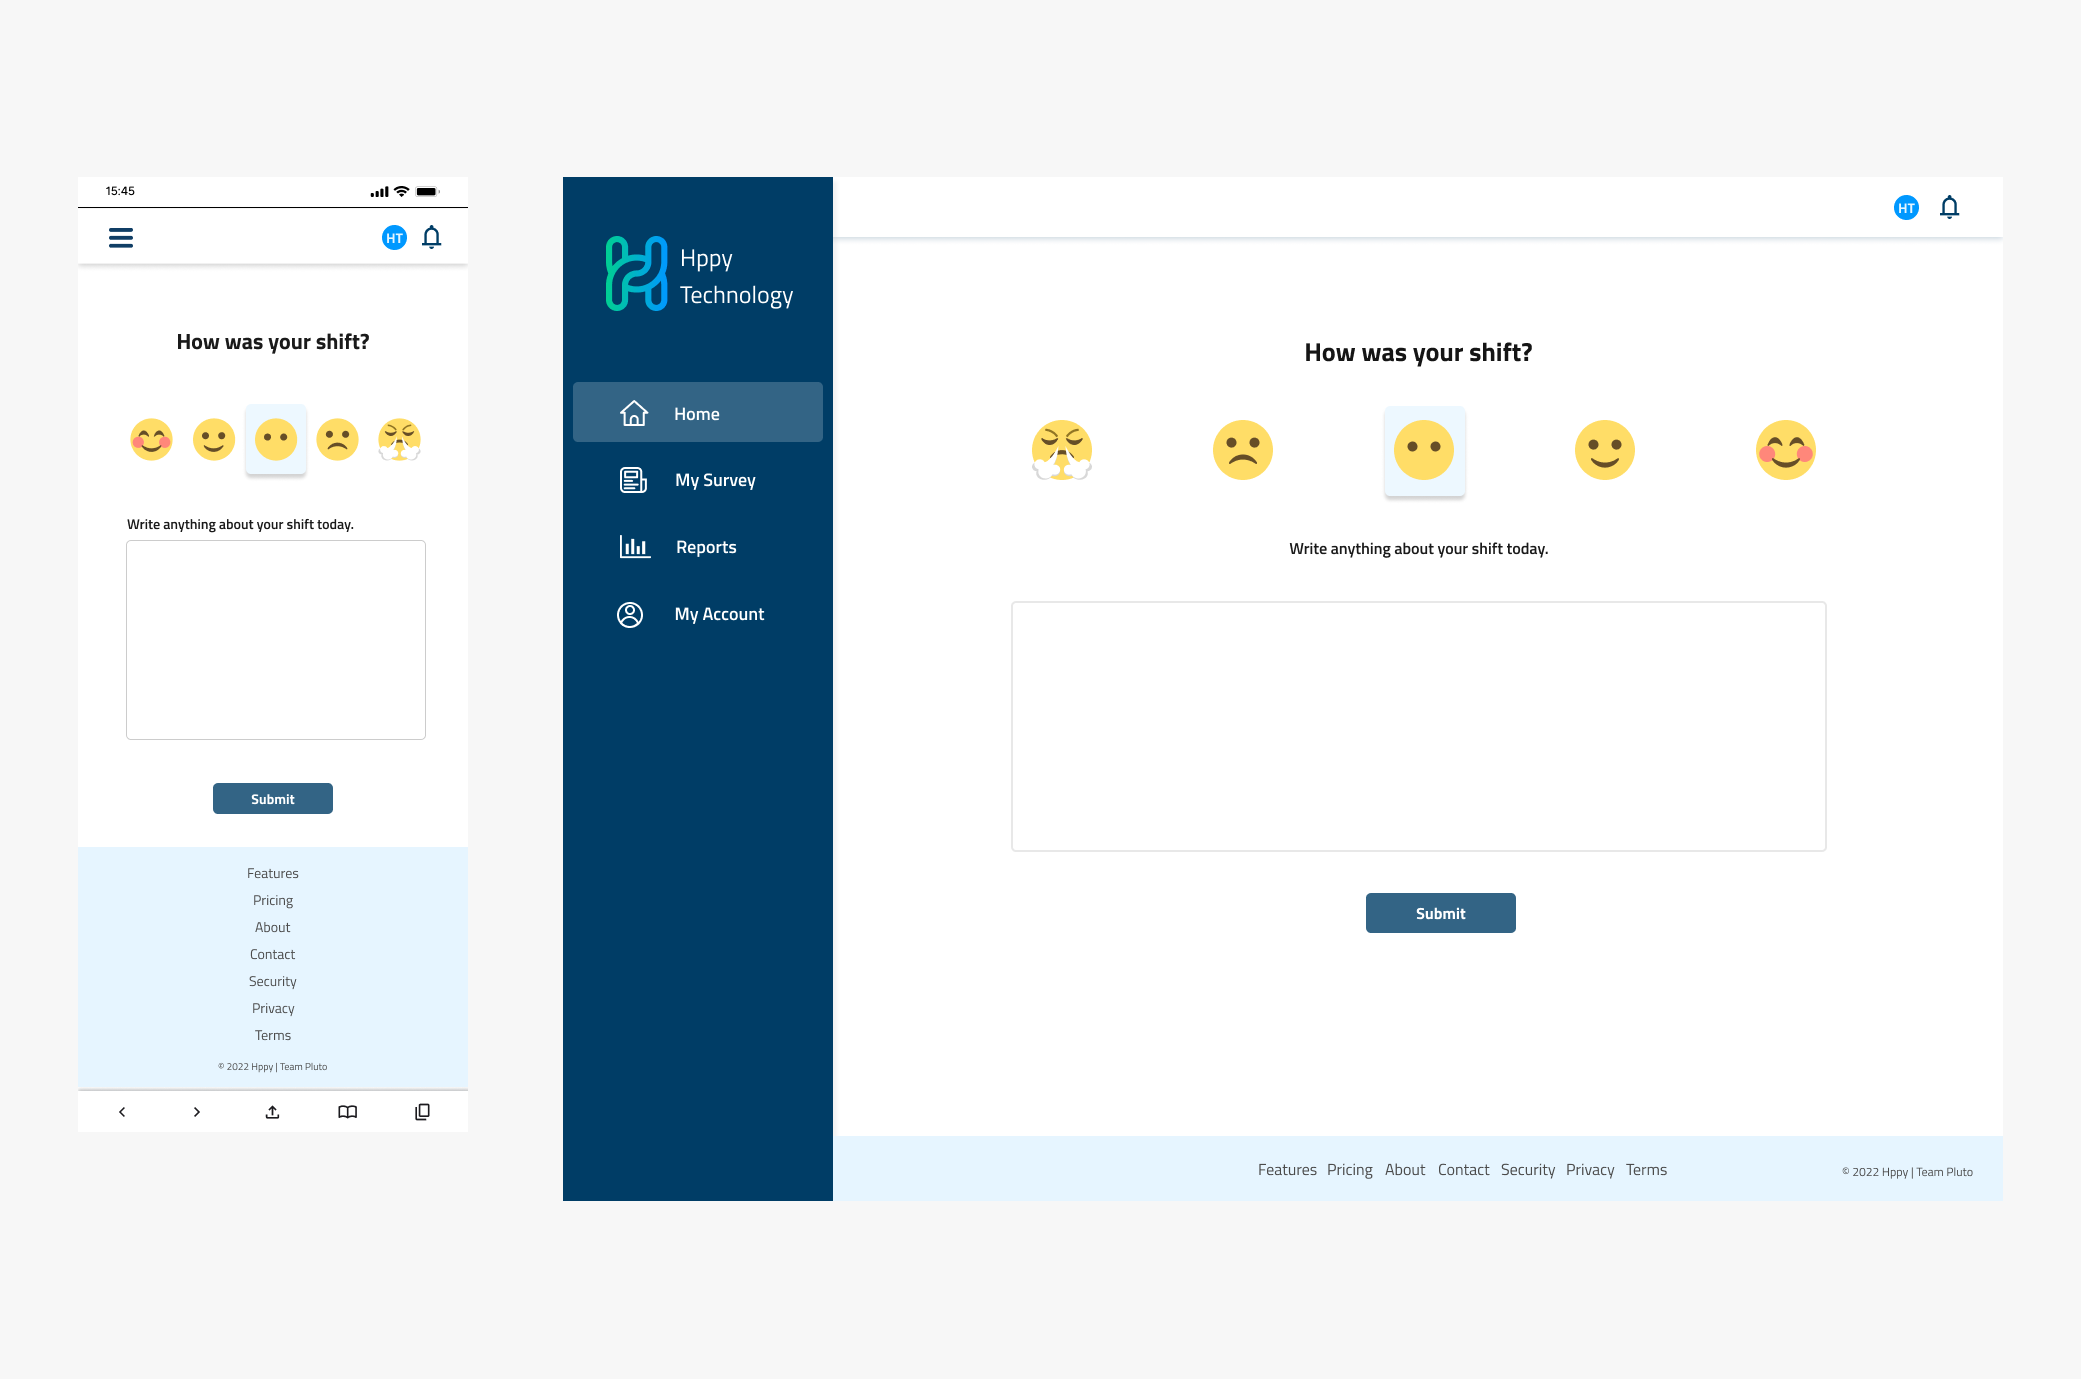
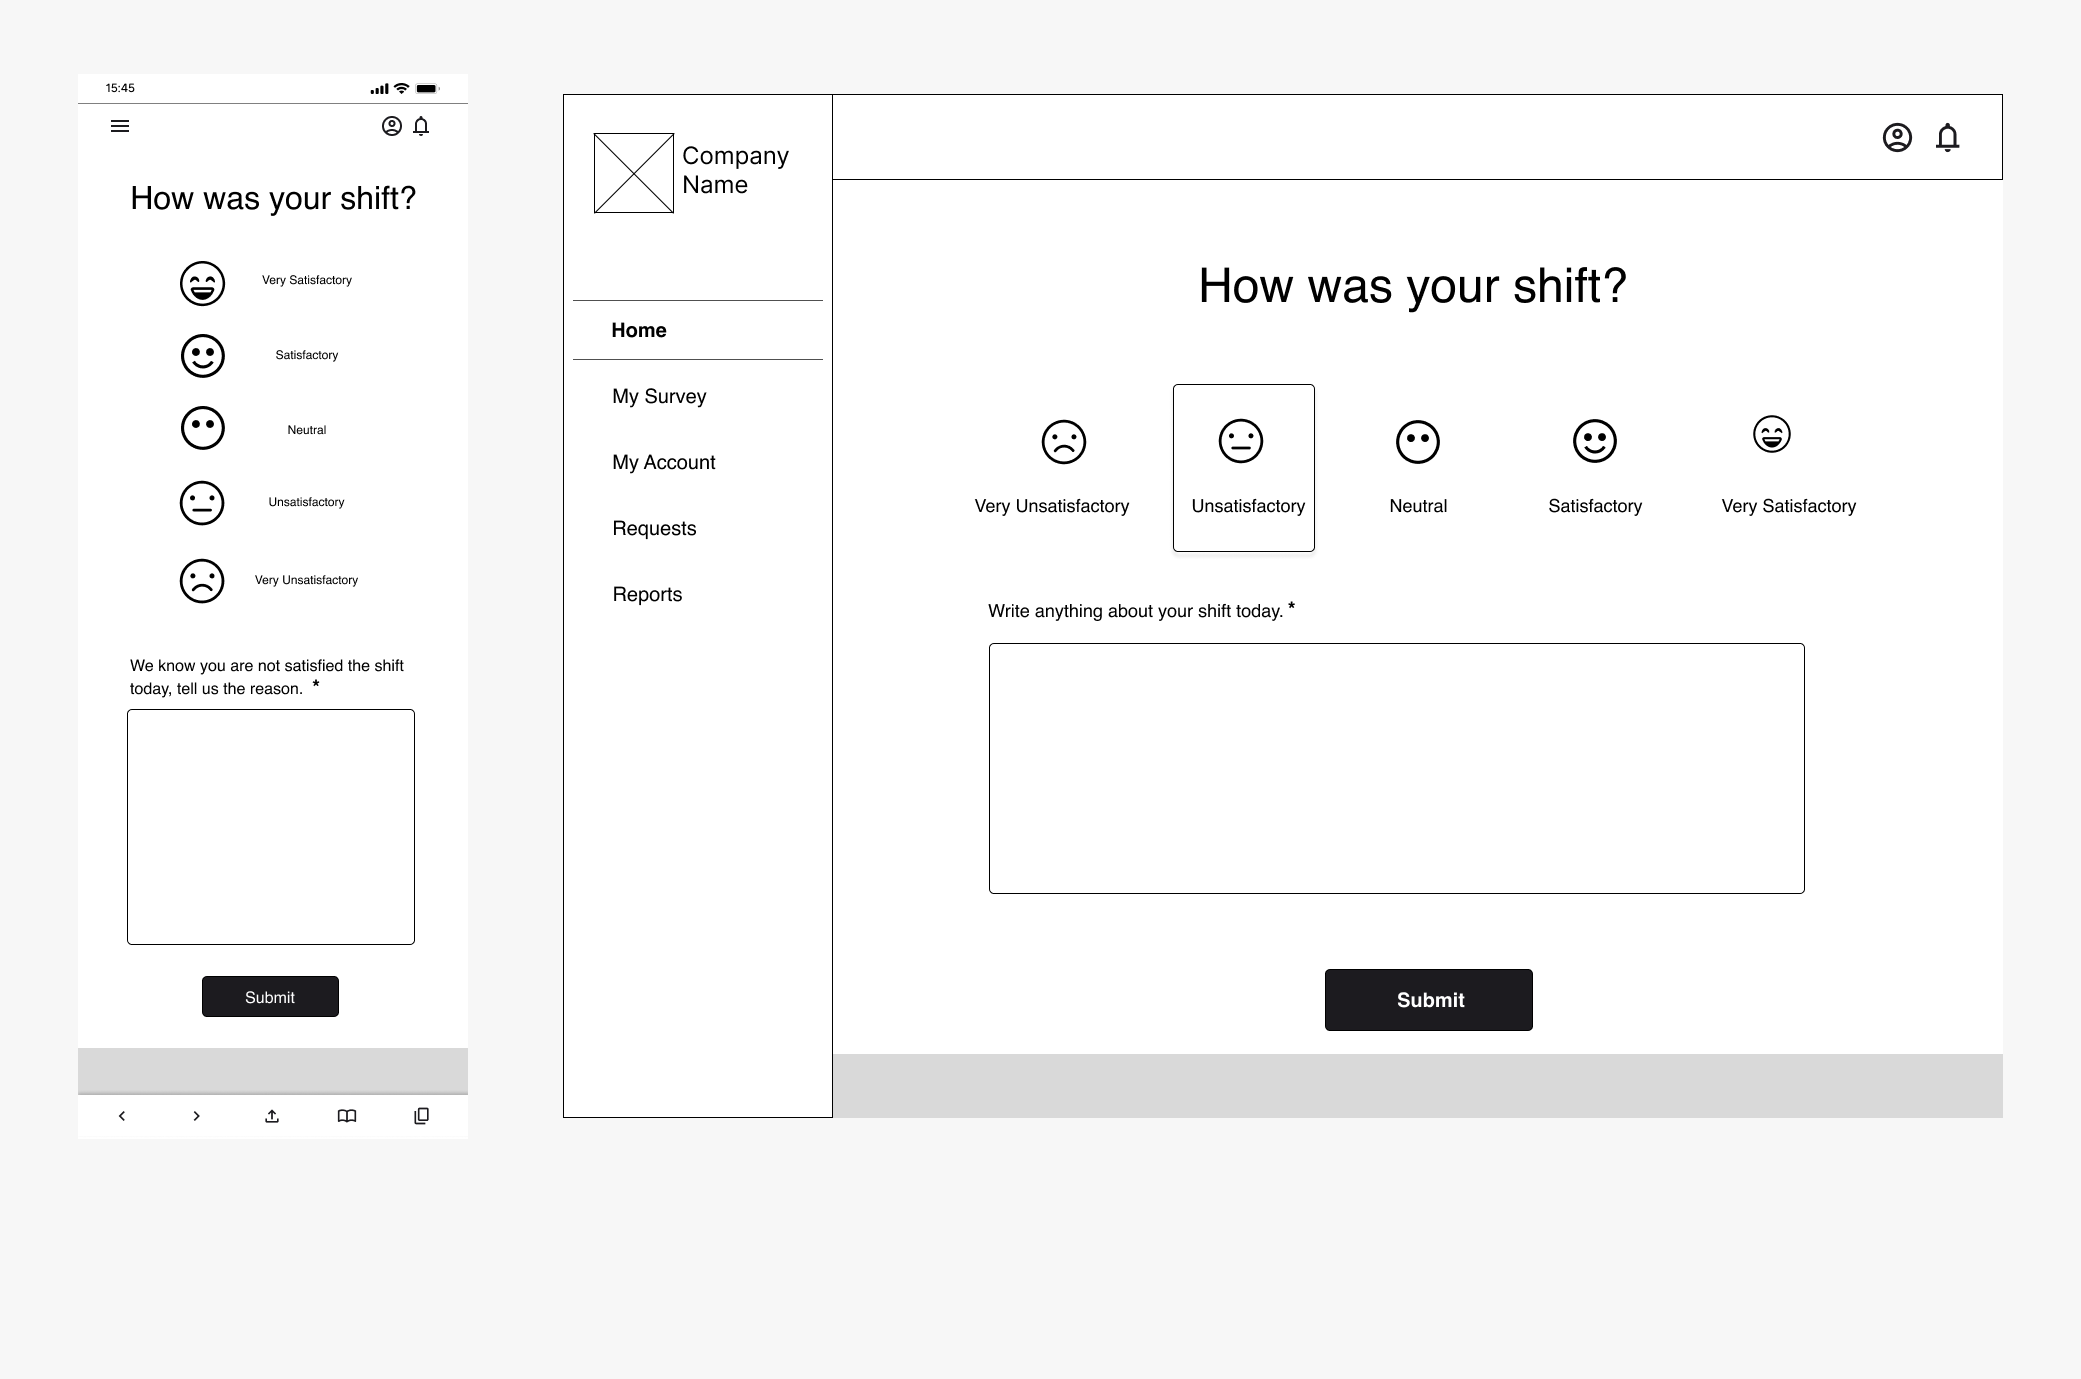
Home/Daily Survey
The Daily Survey is the home page of employees and HODs. Employees are required to fill out and submit the daily survey everyday after their shift. The employee will select one of the 5 emojis representing how they feel about their shift and also leave a feedback.
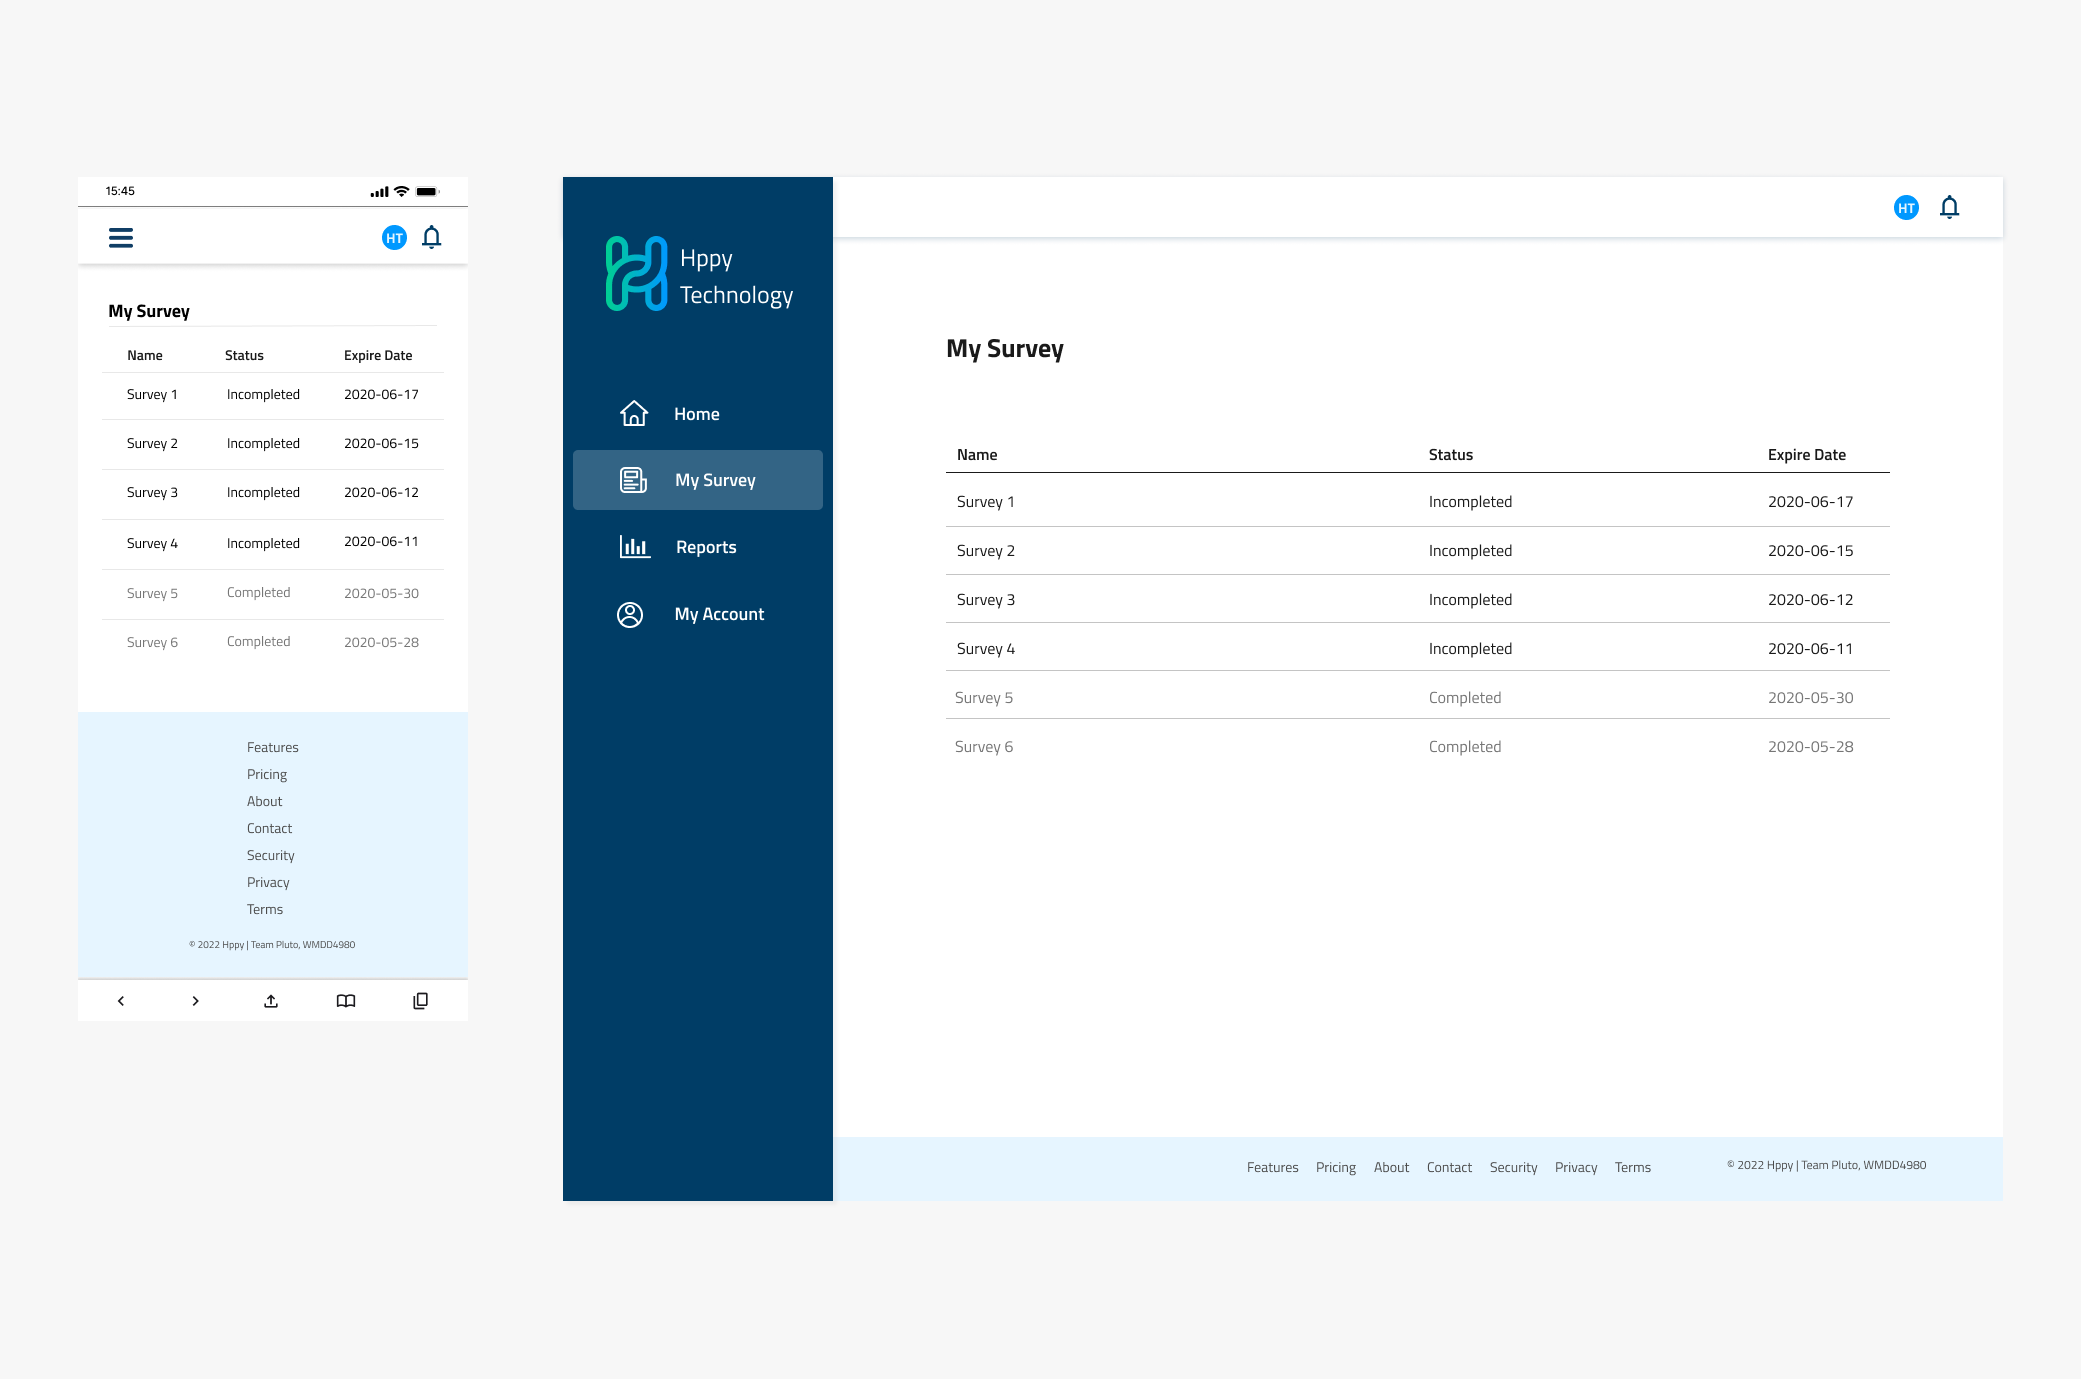
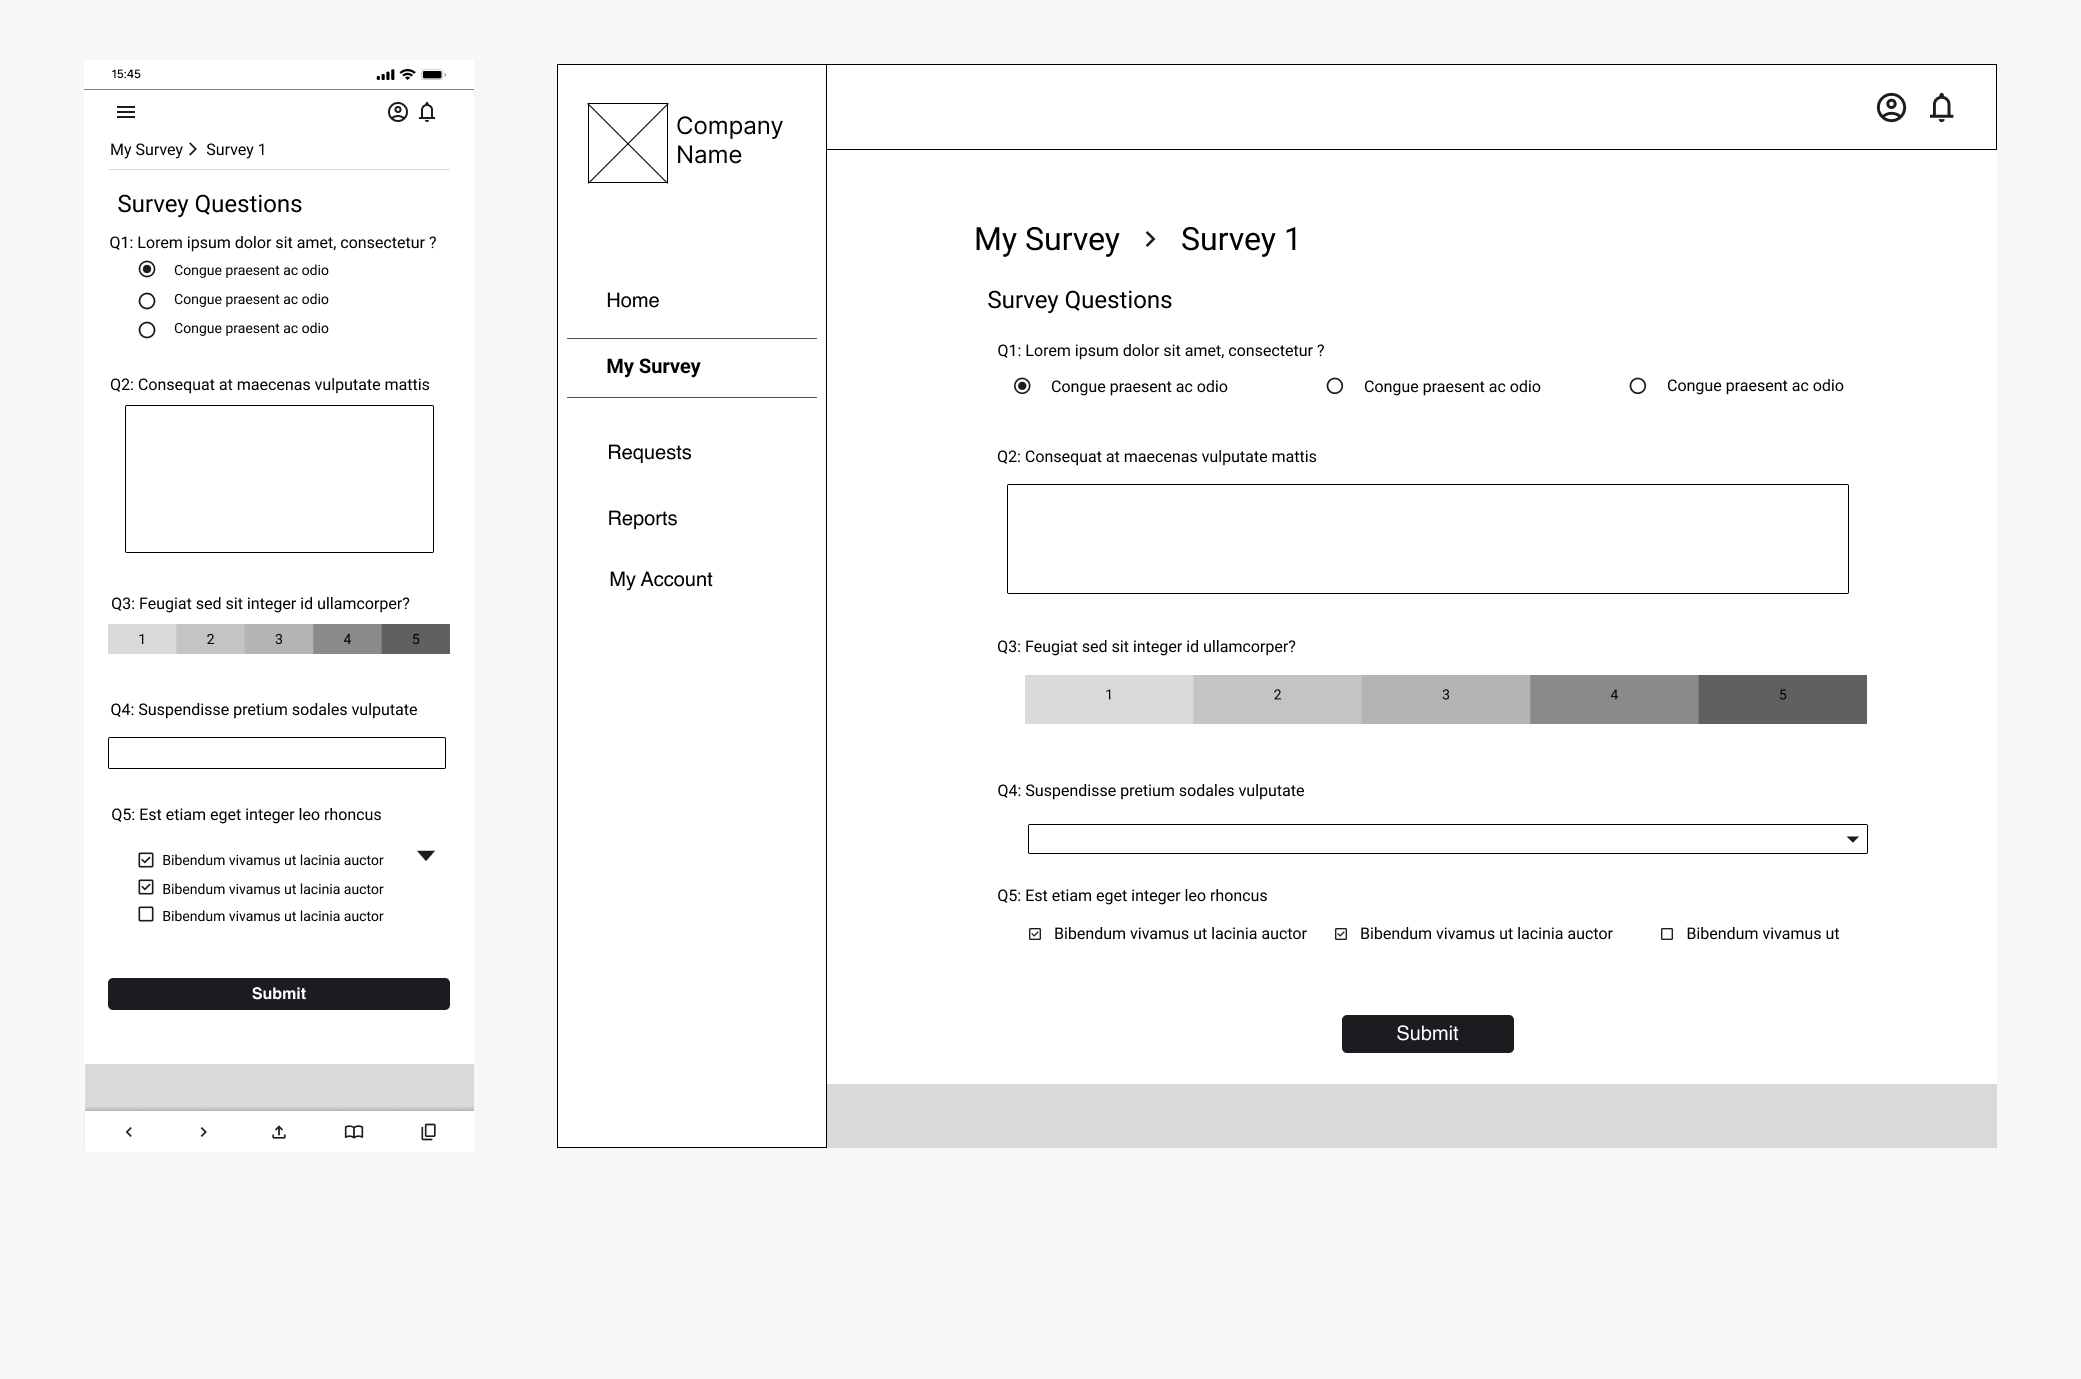
My Survey
My Survey displays the list of surveys an employee or HOD has to fill out. The user has to select one of the surveys from the list and complete it for its status to be changed to ‘complete’.
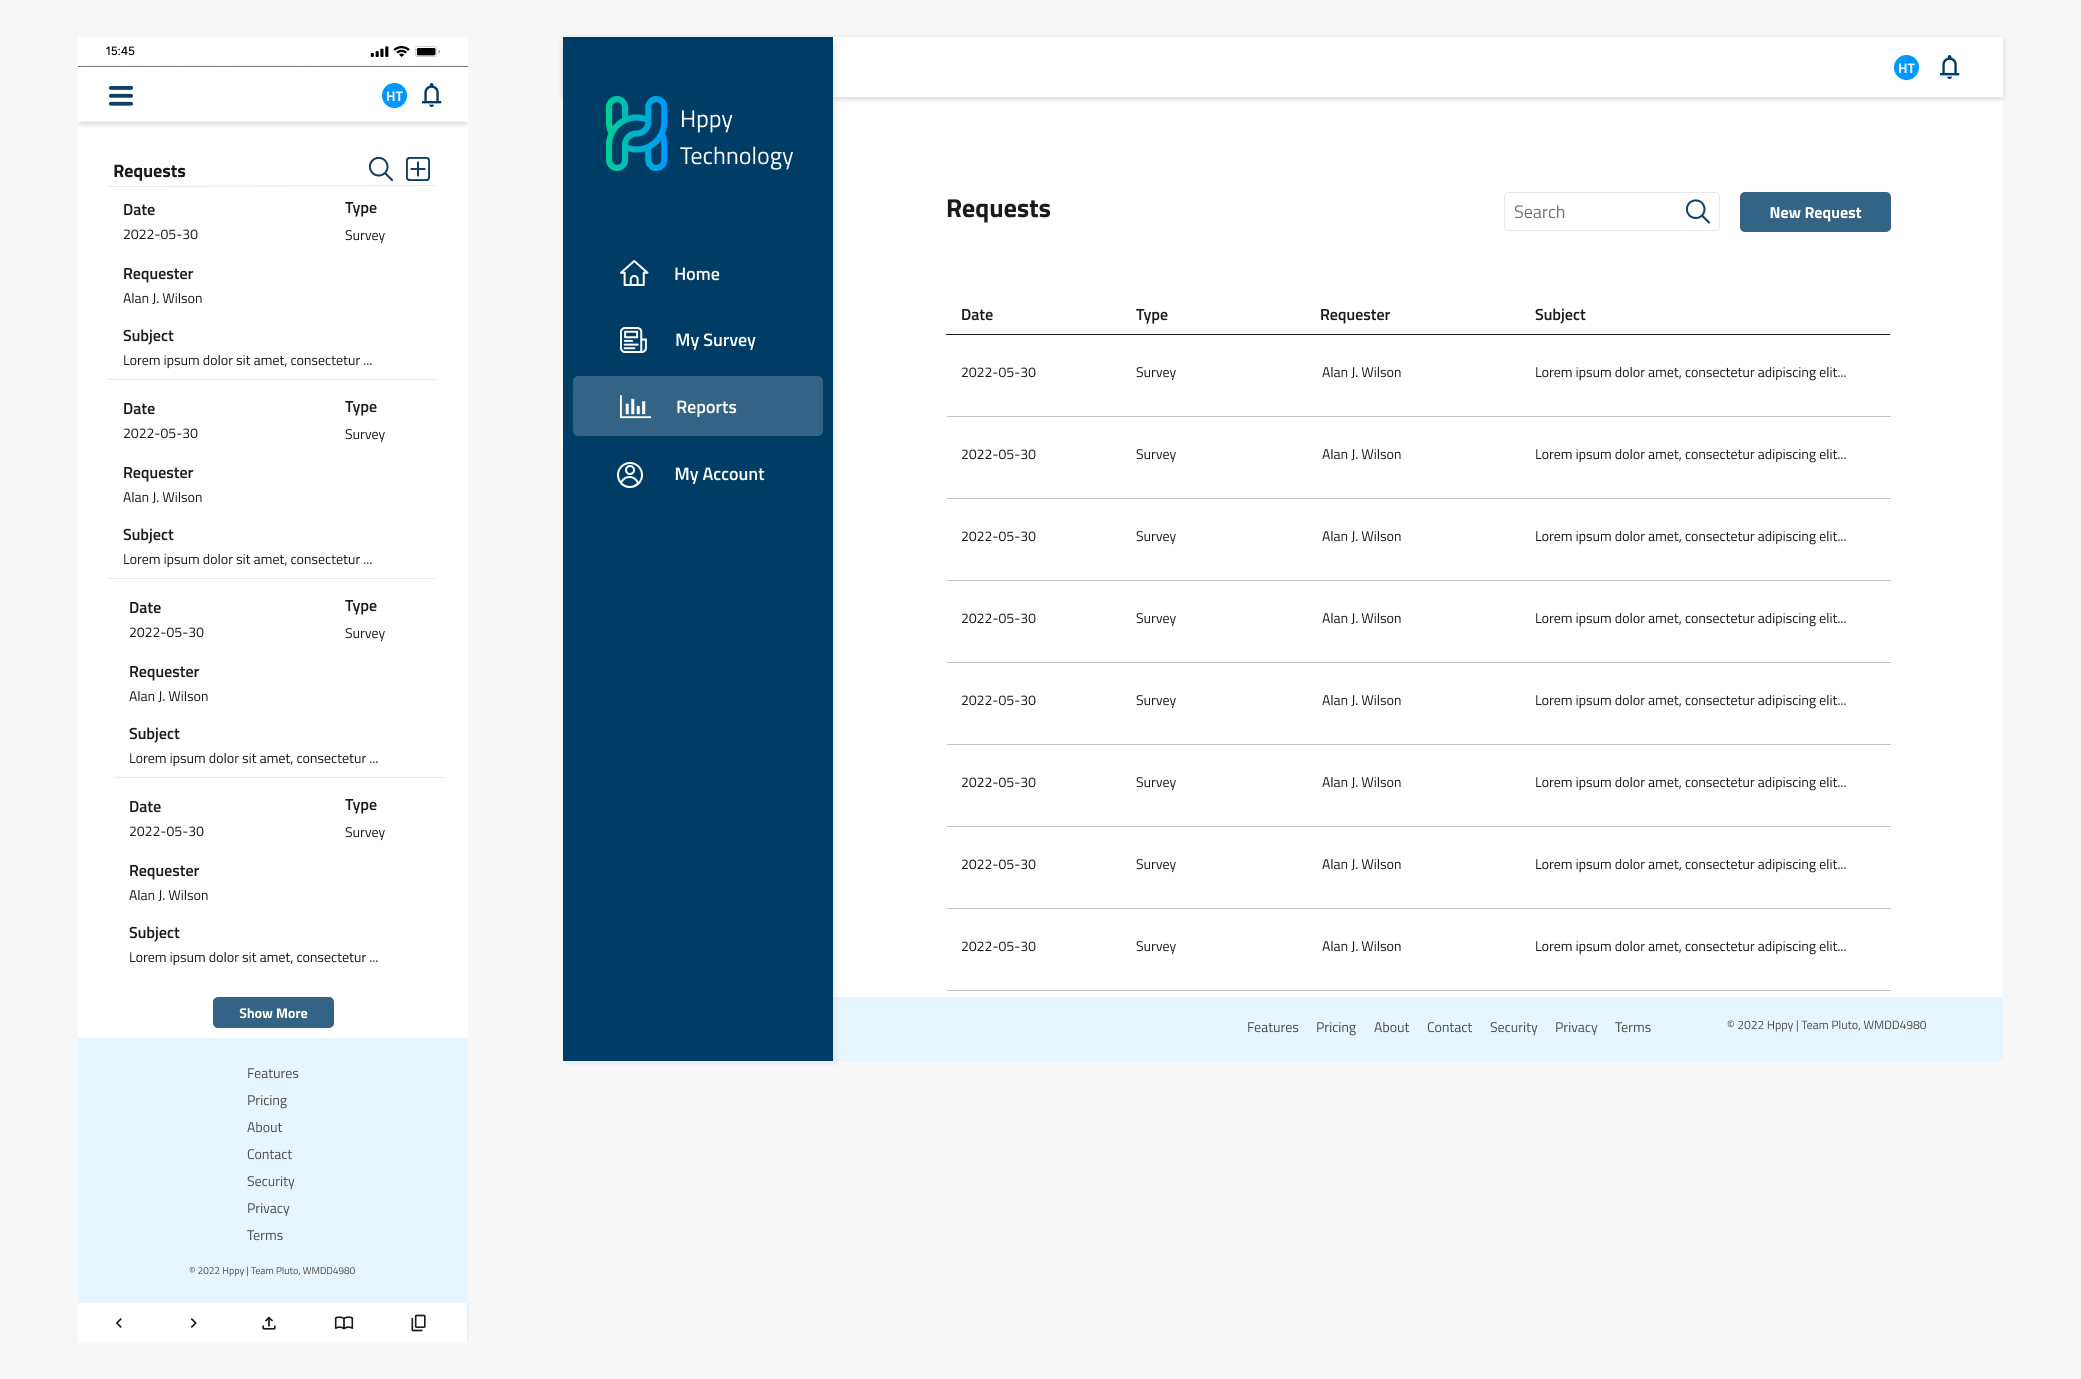
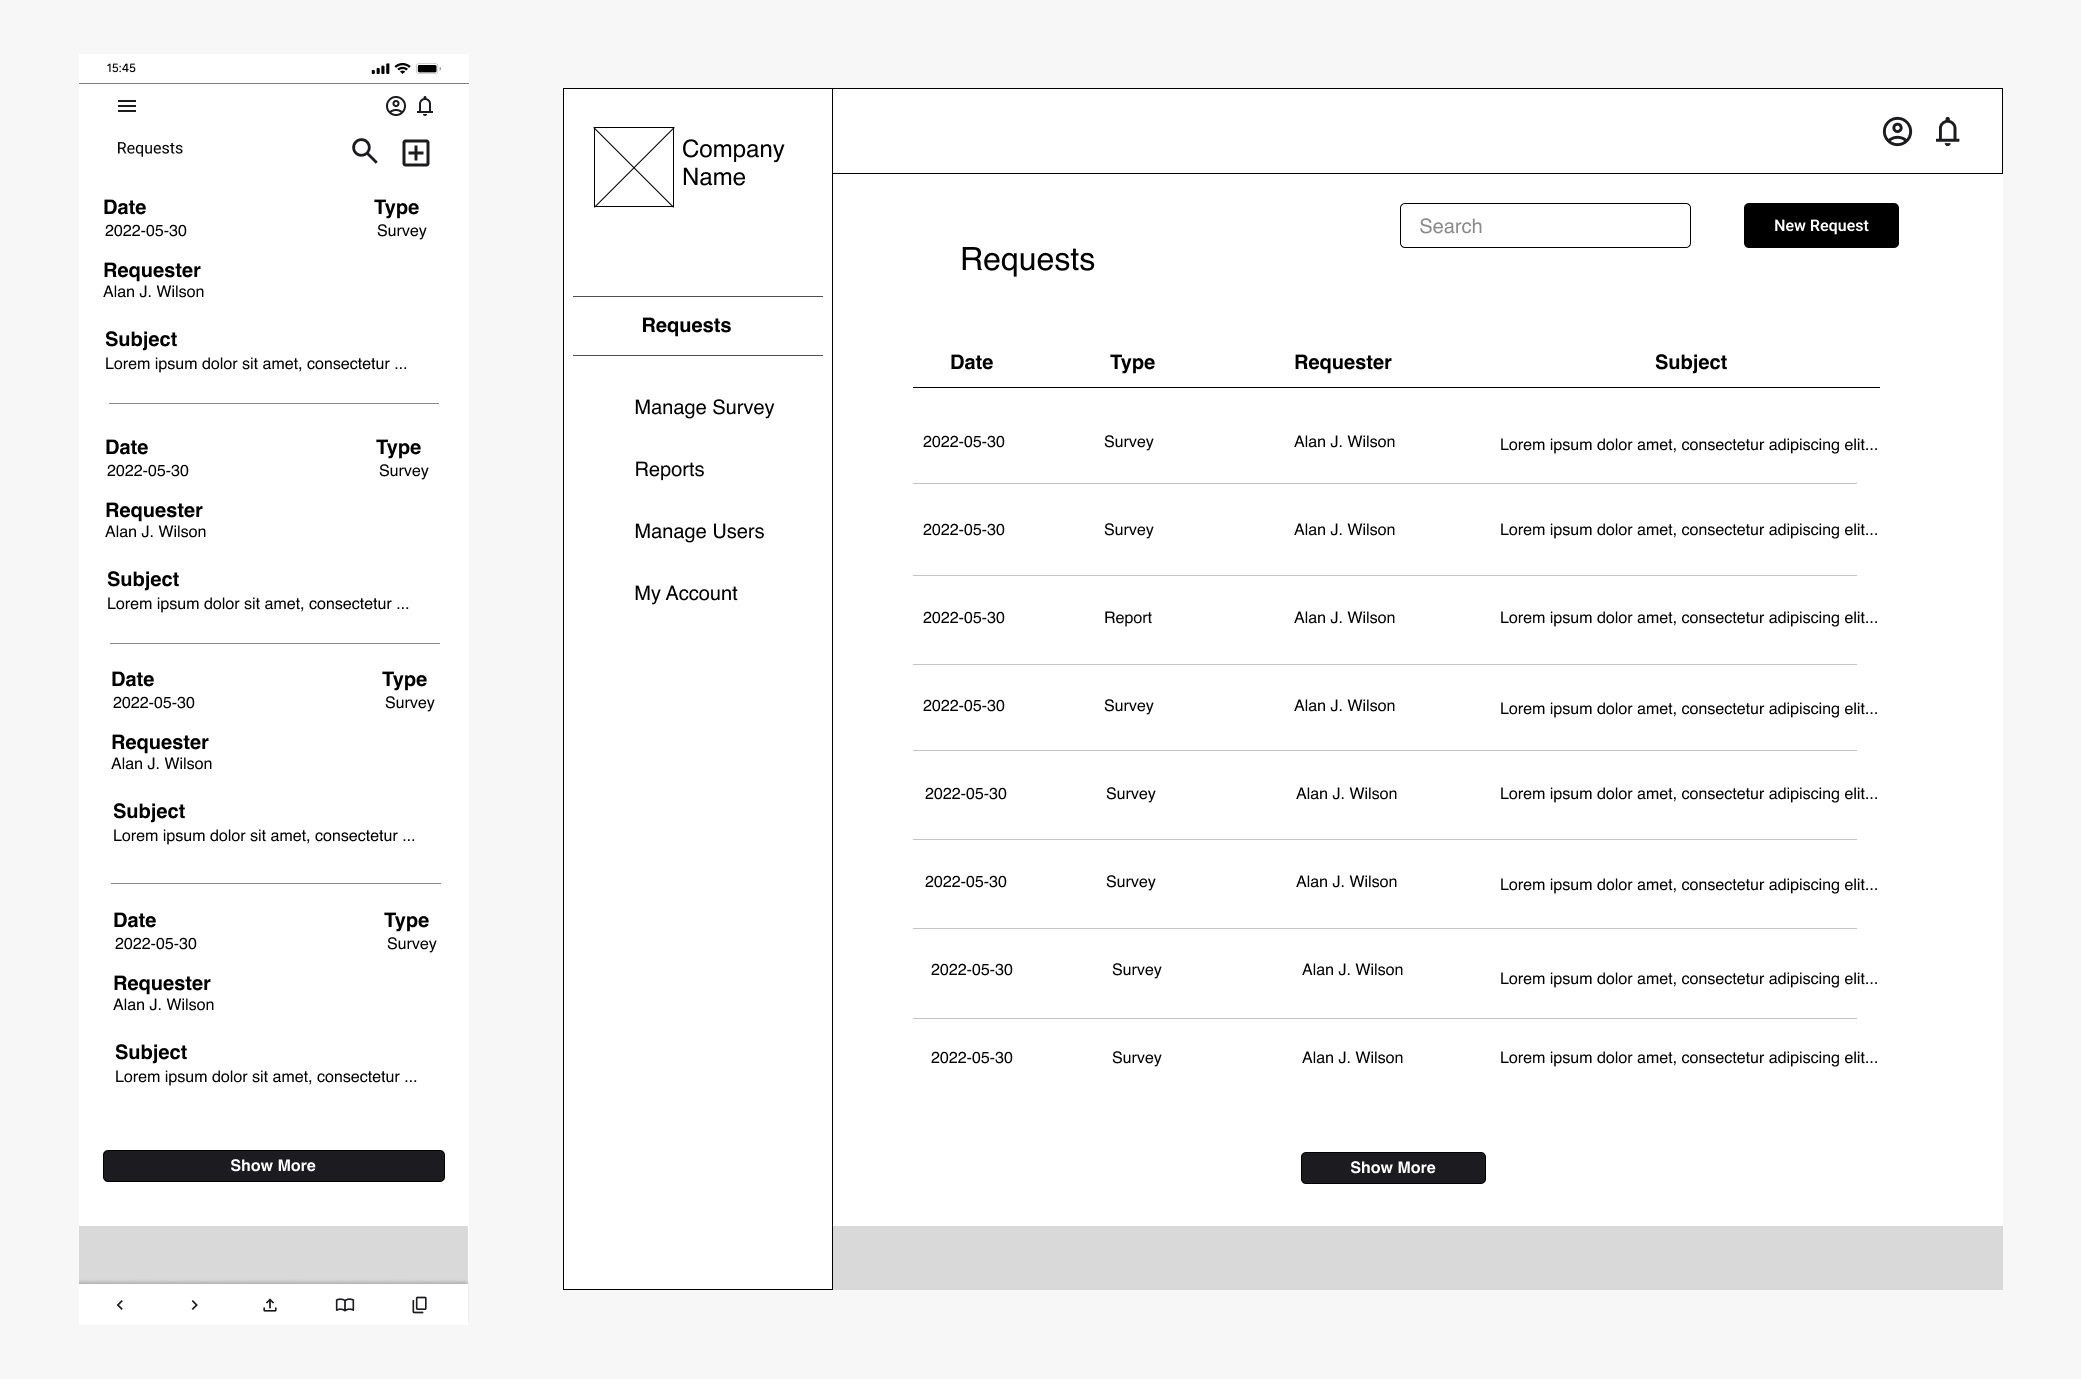
Request
The Request section is shown for the Admin and HOD users. The HOD can create a request for a new survey to be published to their department or a new report to be generated. This request is sent to the Admin.
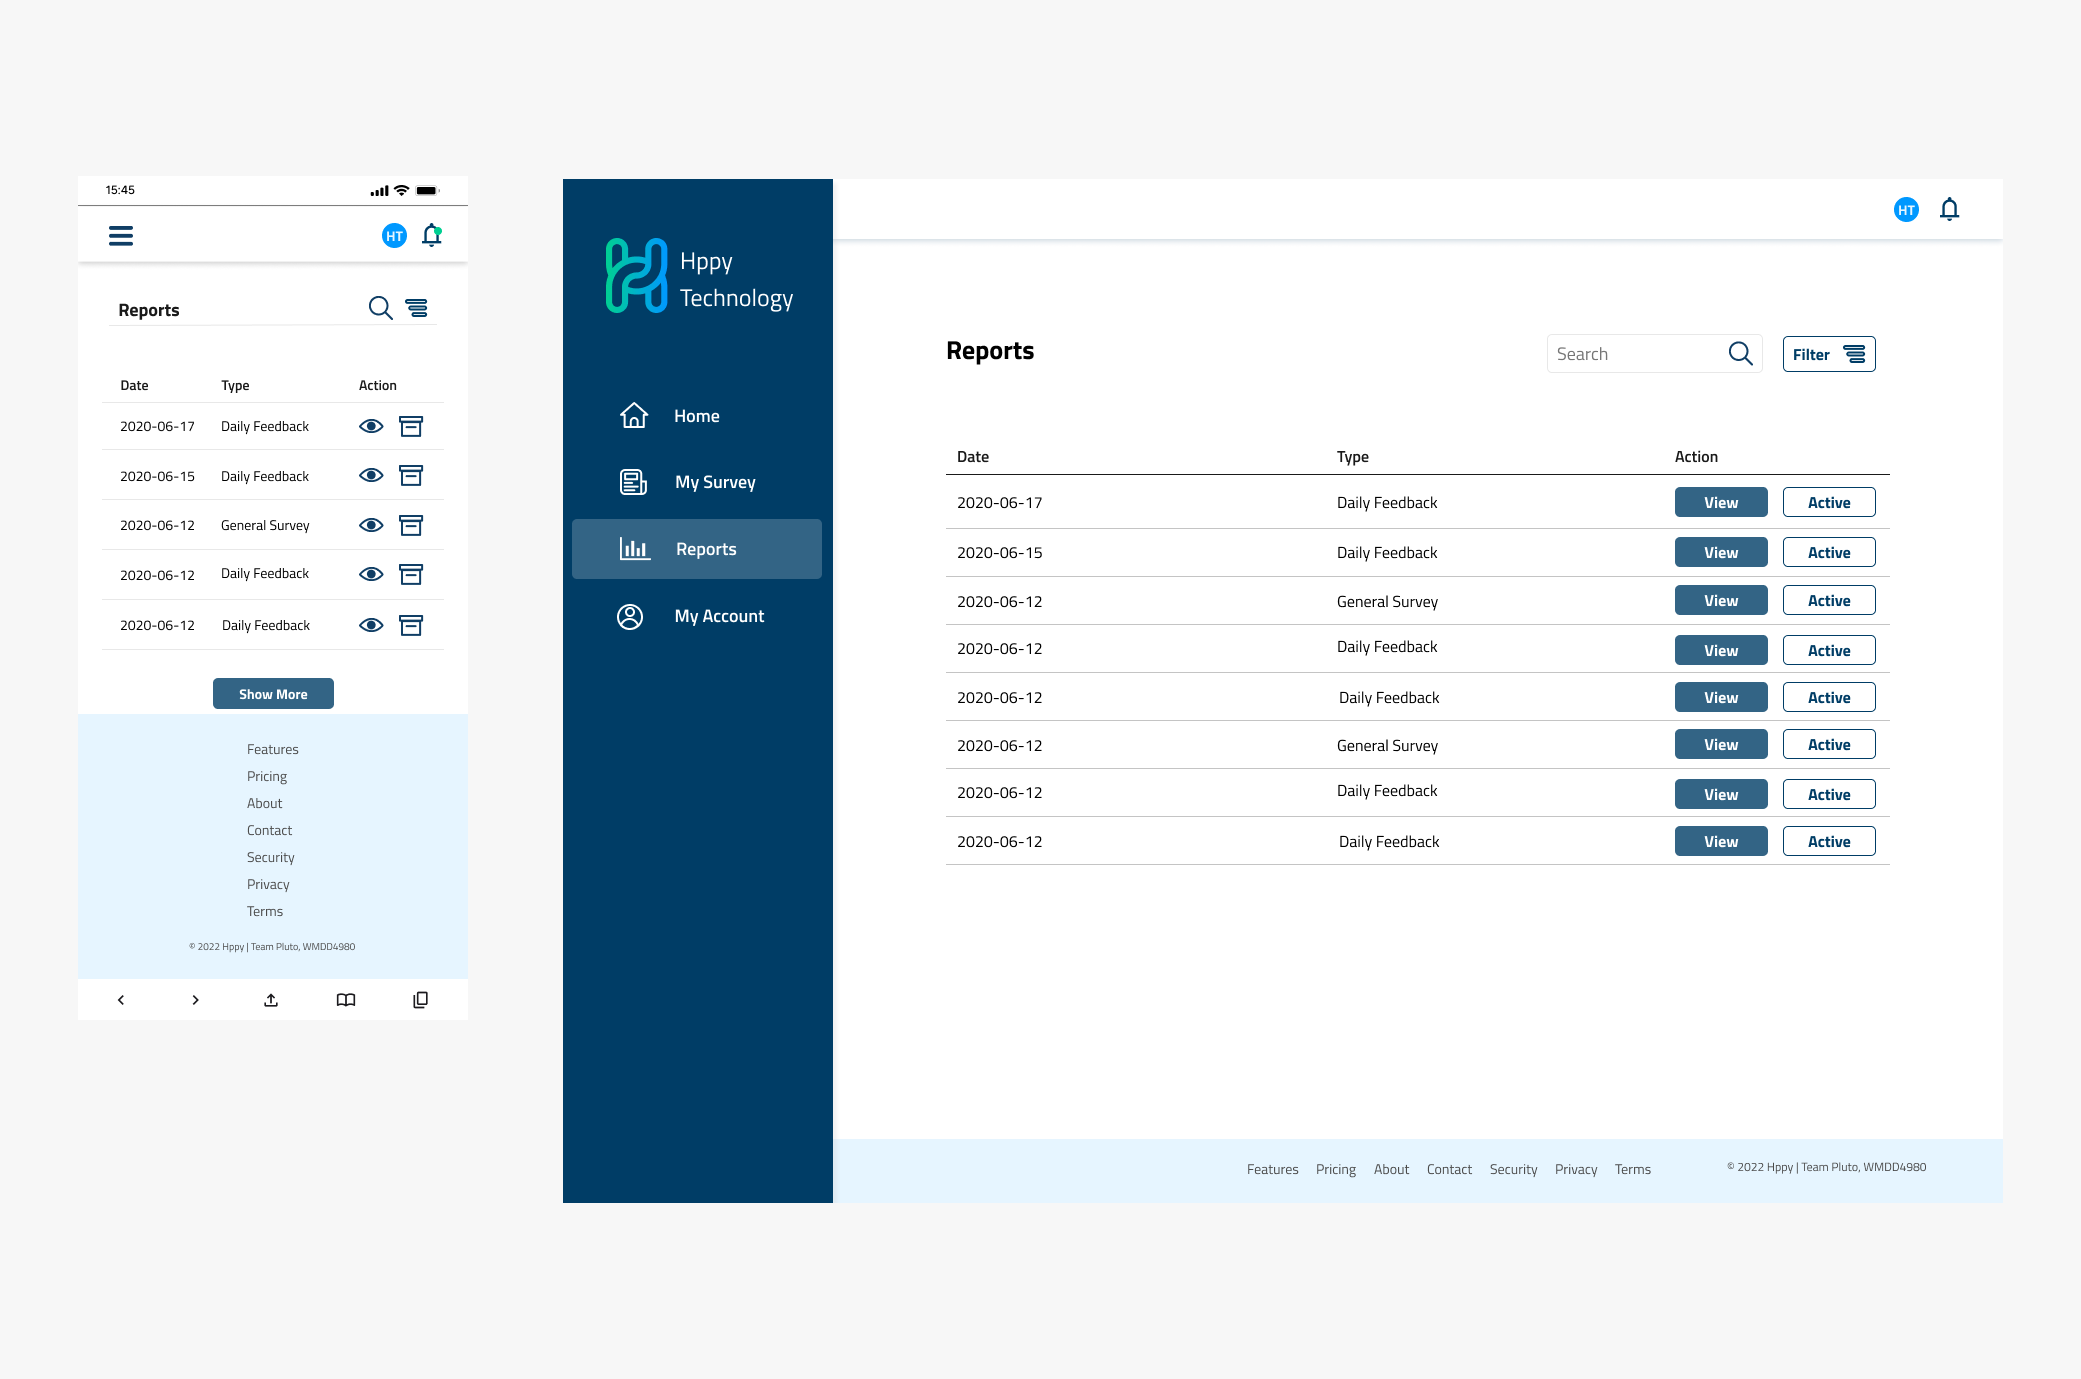
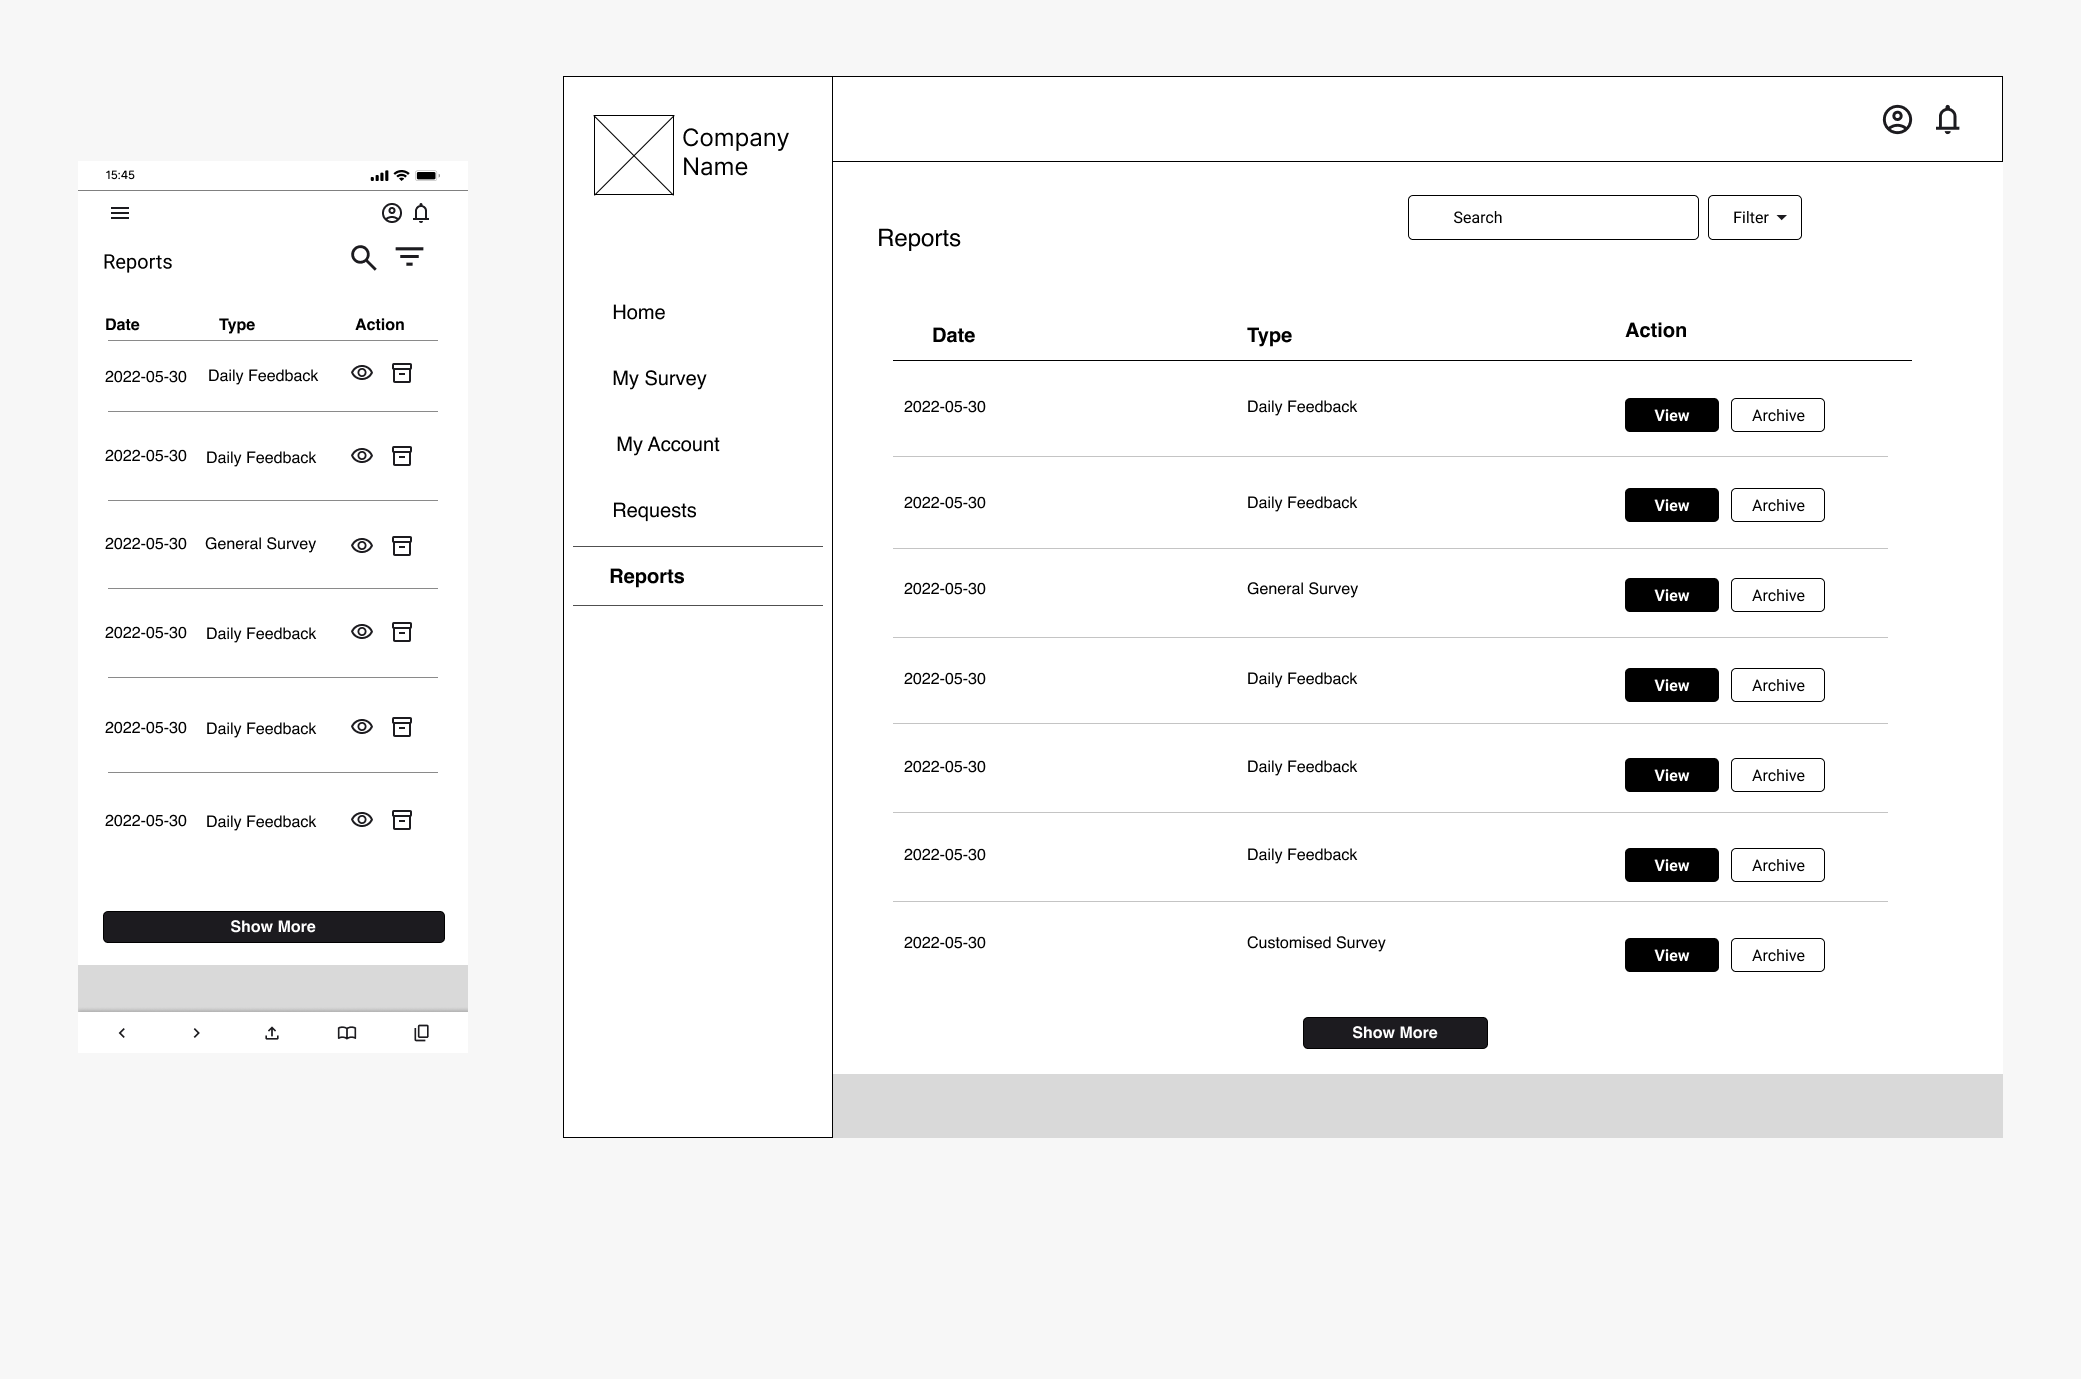
Reports
The Reports section is shown for the Admin and HOD users. Reports are triggered by admin, which are based on the survey responses.
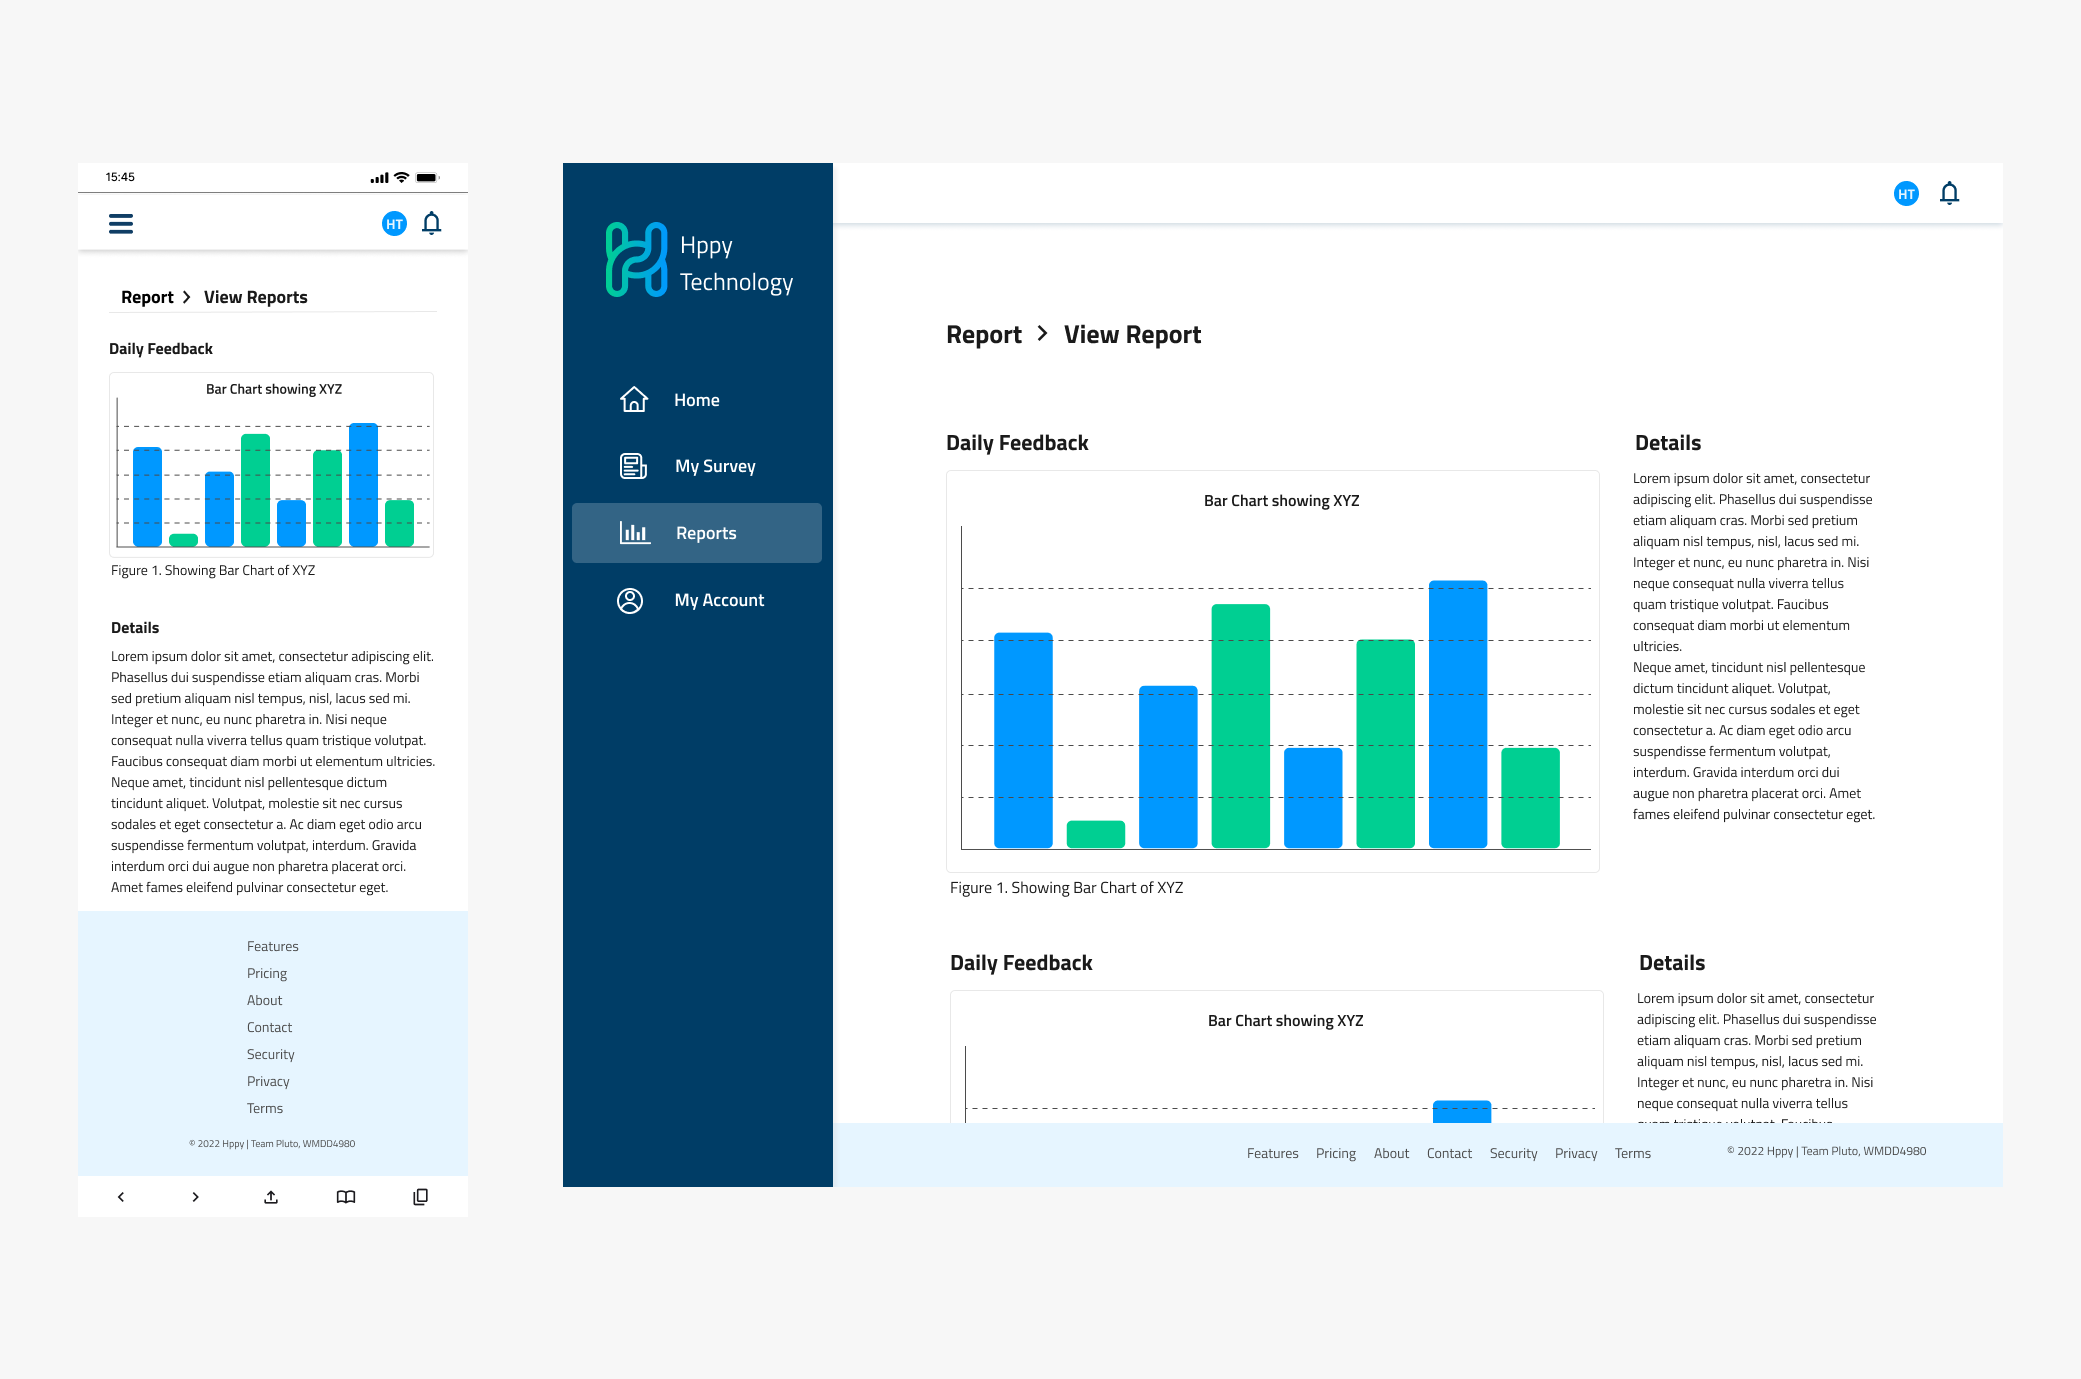
View Report
The View Report shows the report details for a specific survey. This can be a daily survey or weekly/monthly survey.
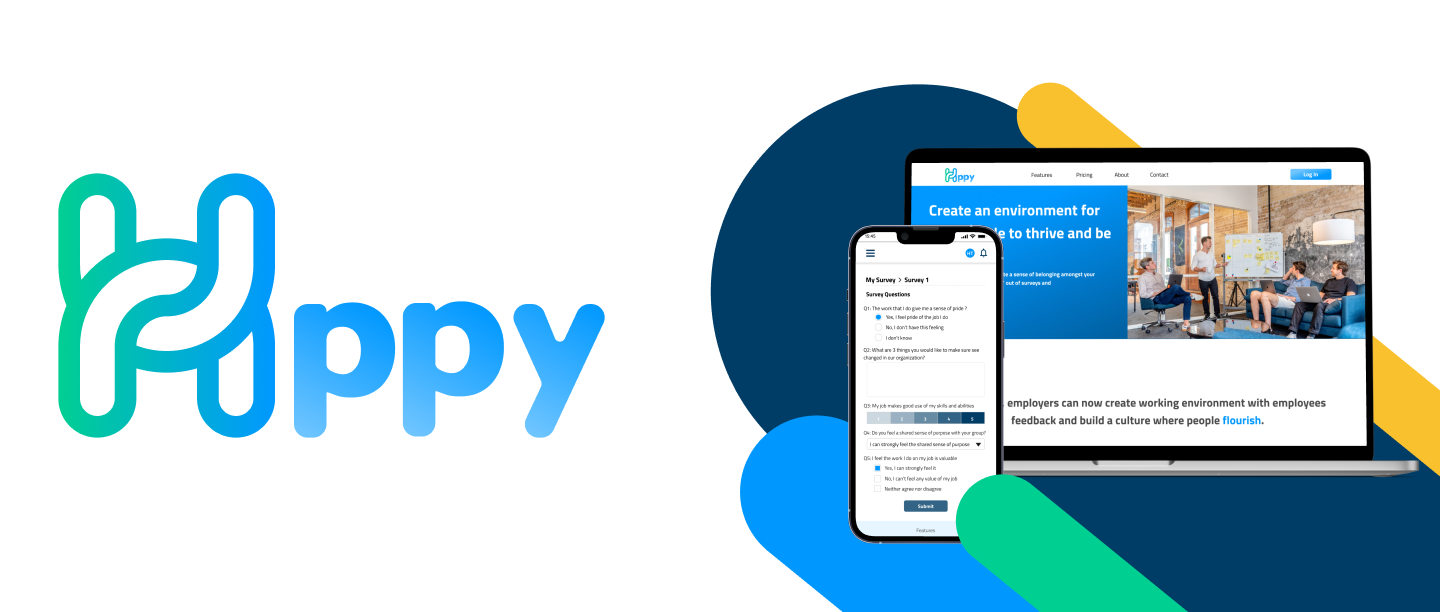
Logo
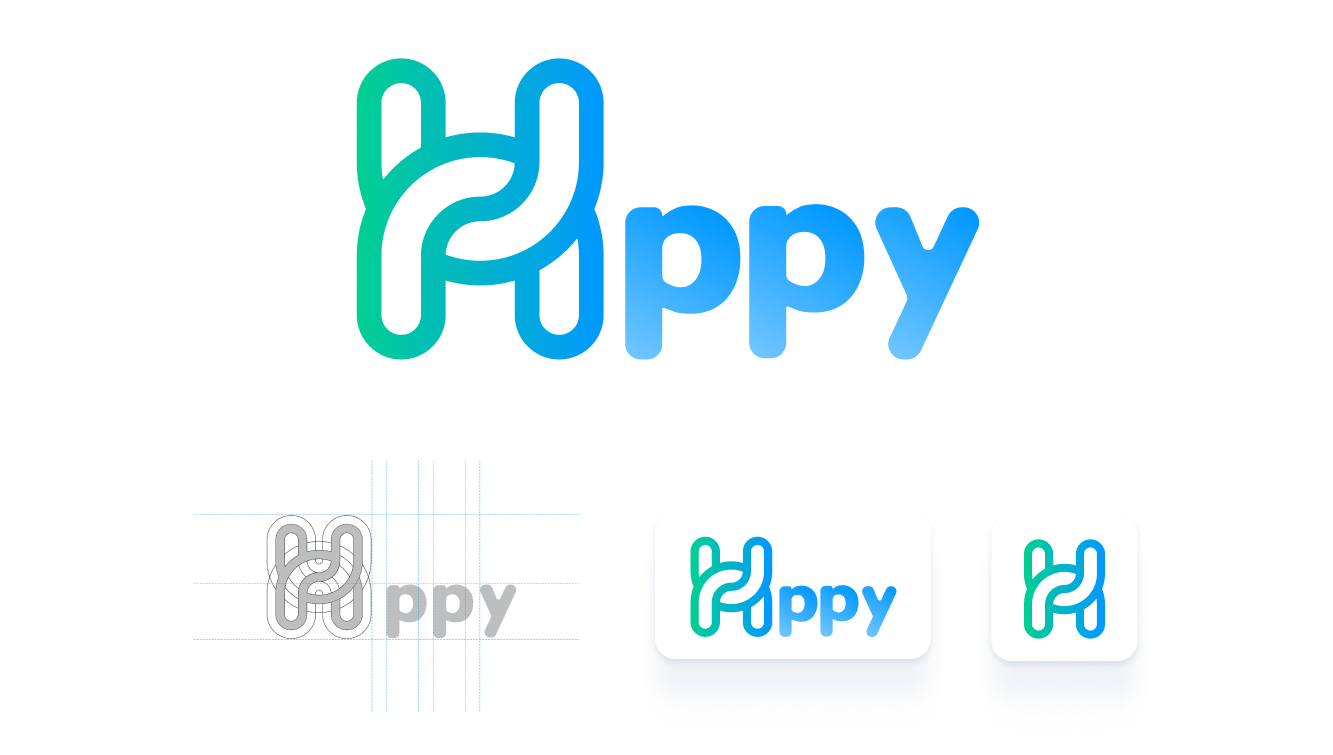
The H in the logo is formed from a chain link. This was done intentionally to bring across the link between employees and employers. Additionally, the green and blue colours were chosen as they represent happiness and joy.
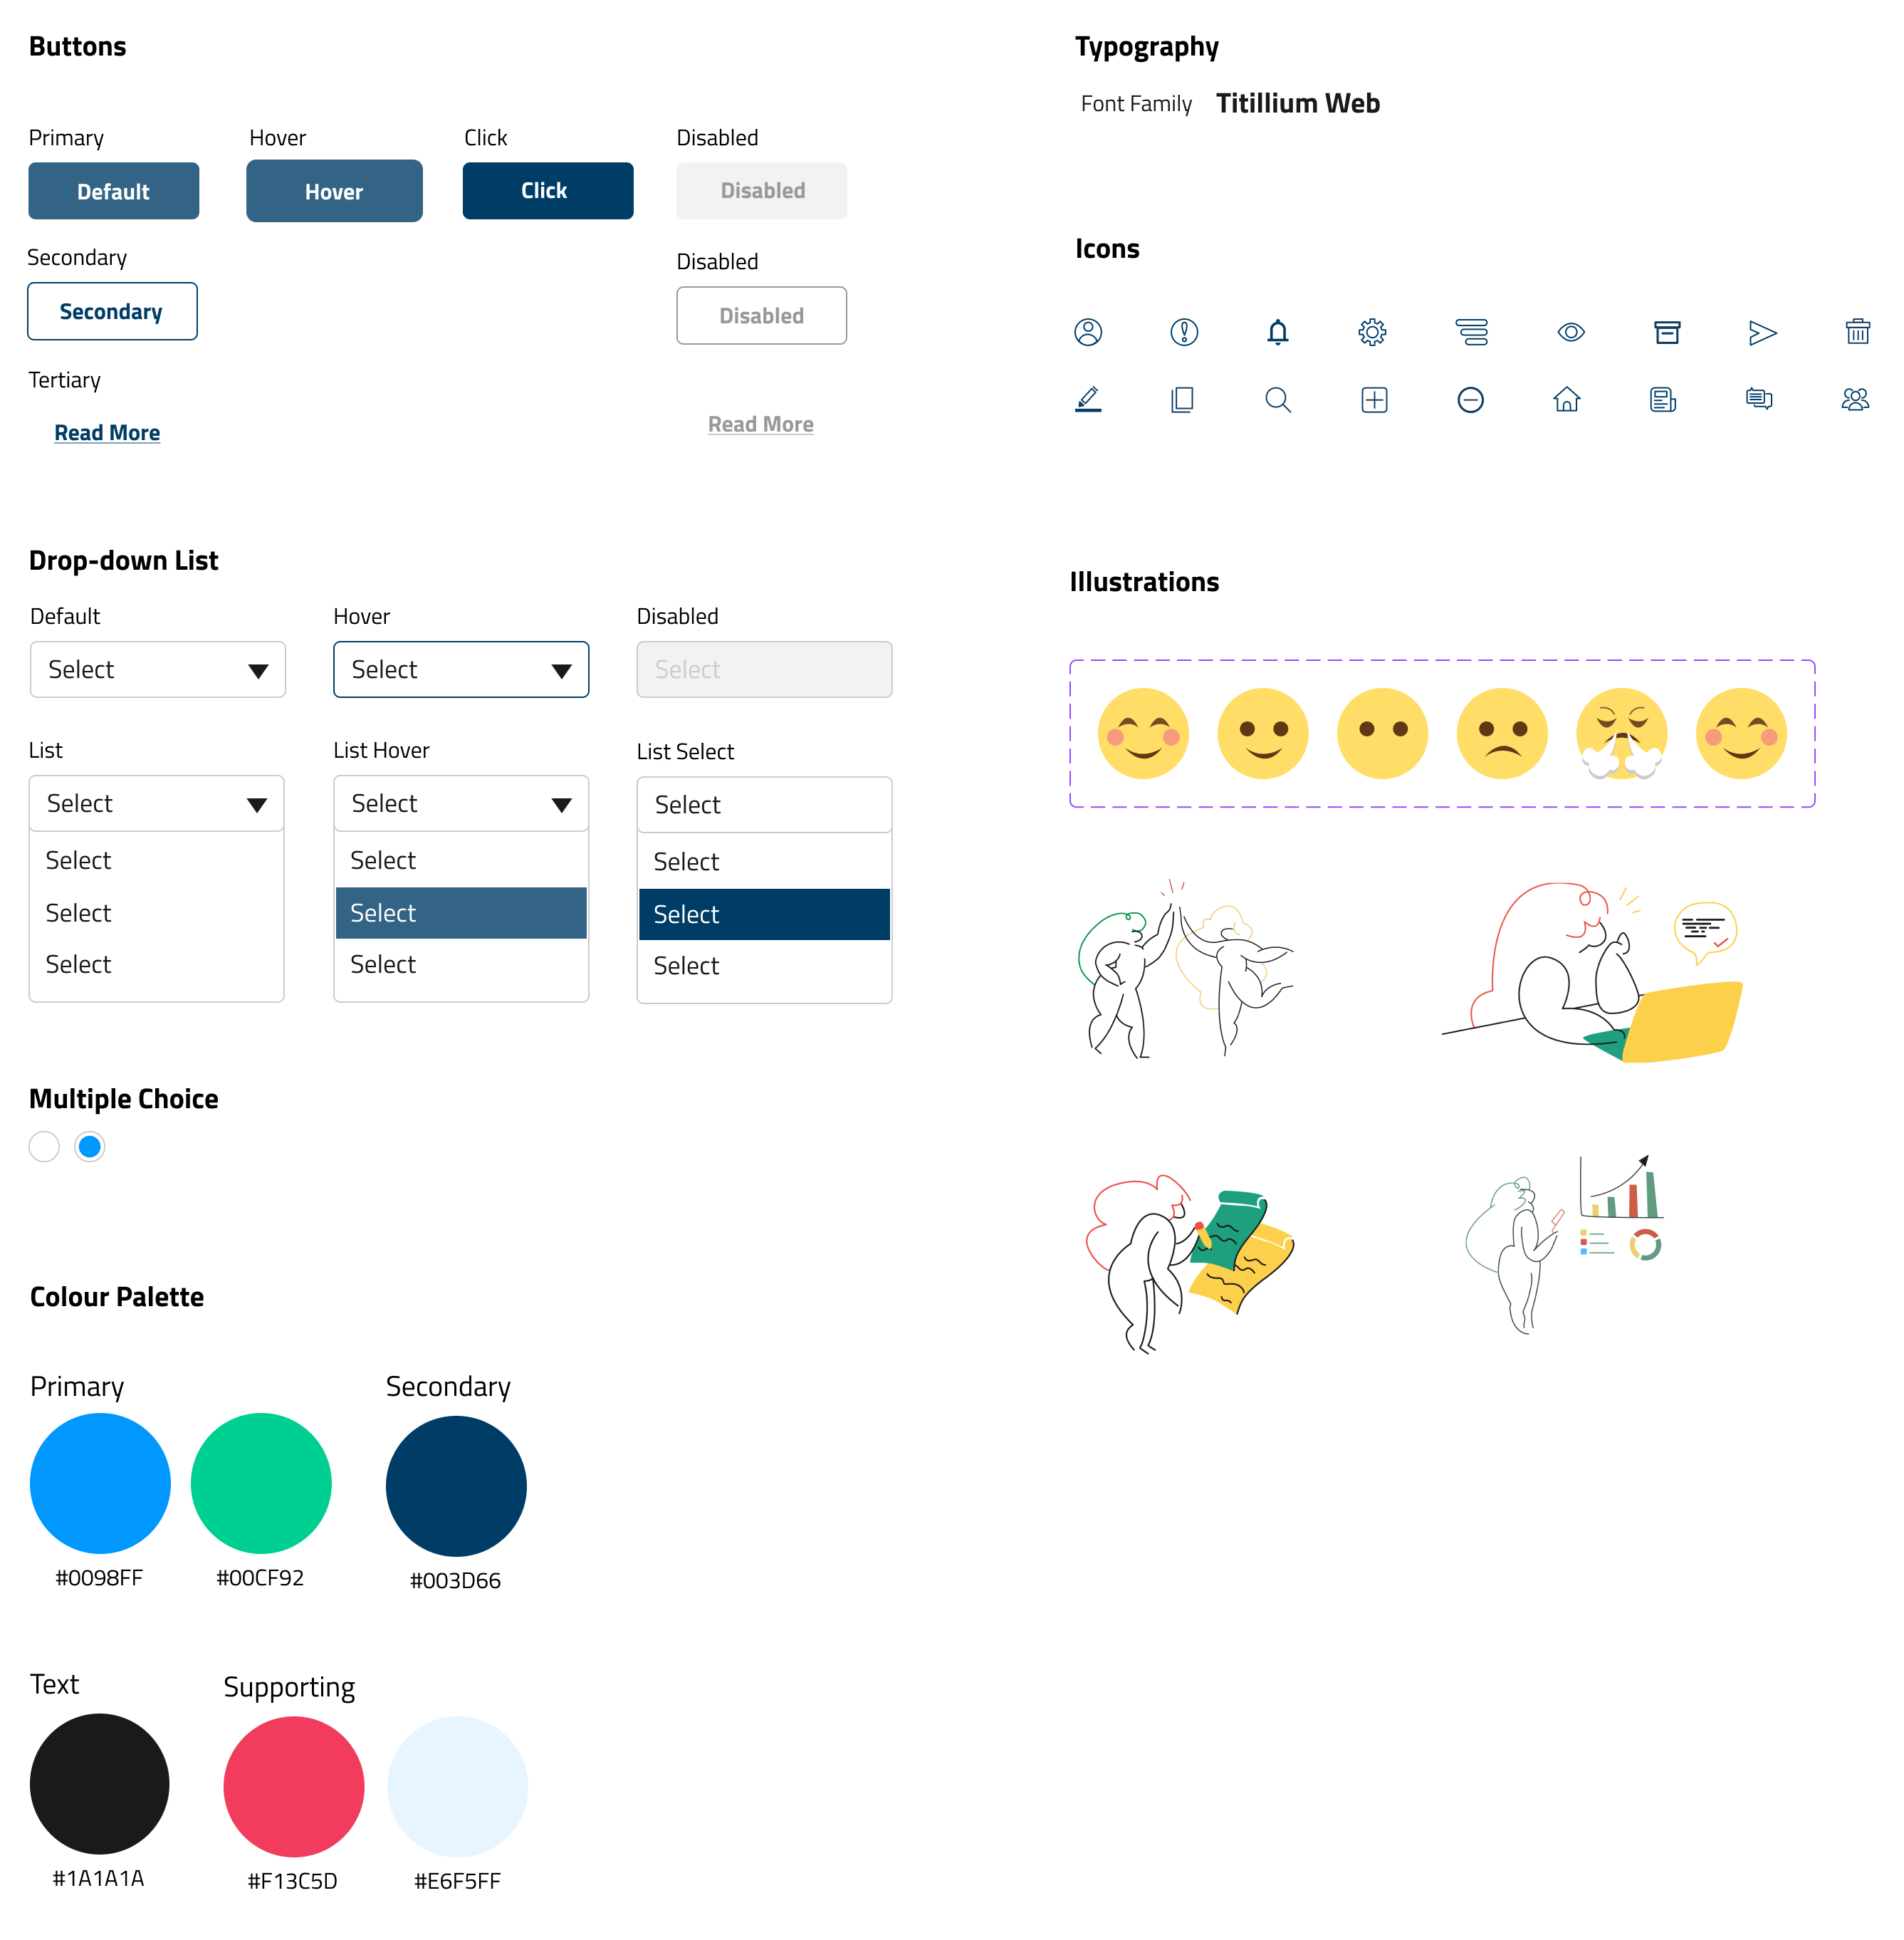
UI Kit